Infographics
Project Summary
Every two days the world creates as much information as it did from the beginning of civilization until 2003. To process data faster and learn quicker in this fast-paced, technology-driven world, visual presentation is a huge help. Graphics, combined with organized content and crisply edited headlines, help people understand the gist of a story faster and easier.
Highlights
Social Media / Mobile
Large Format
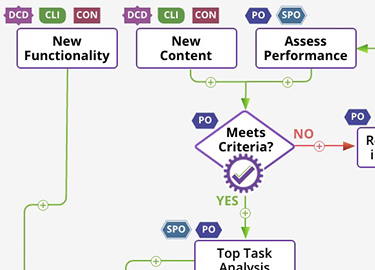
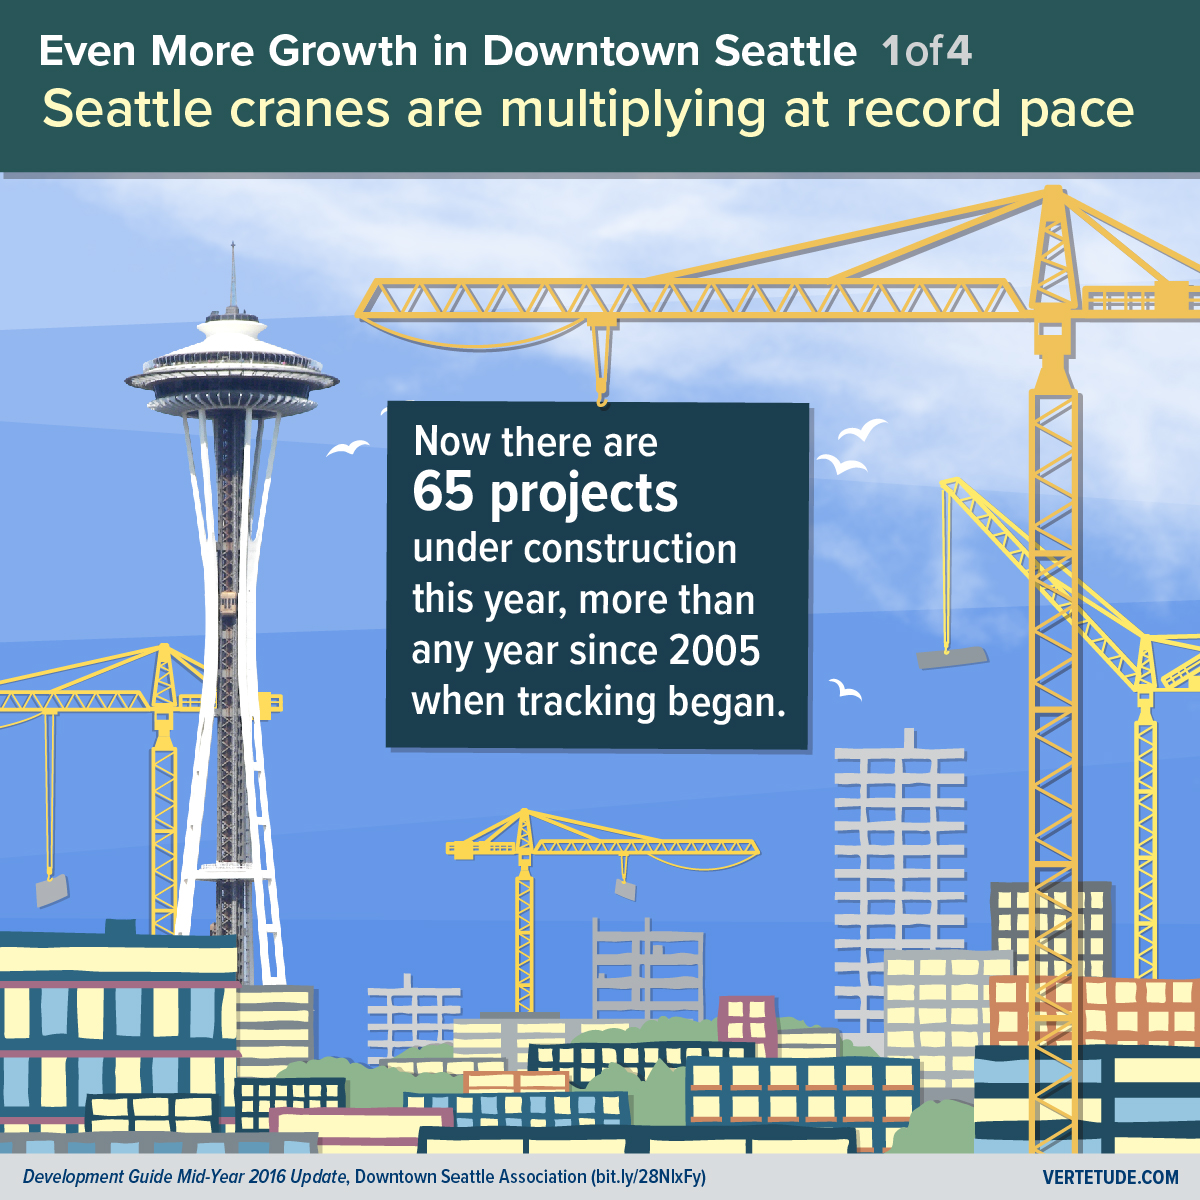
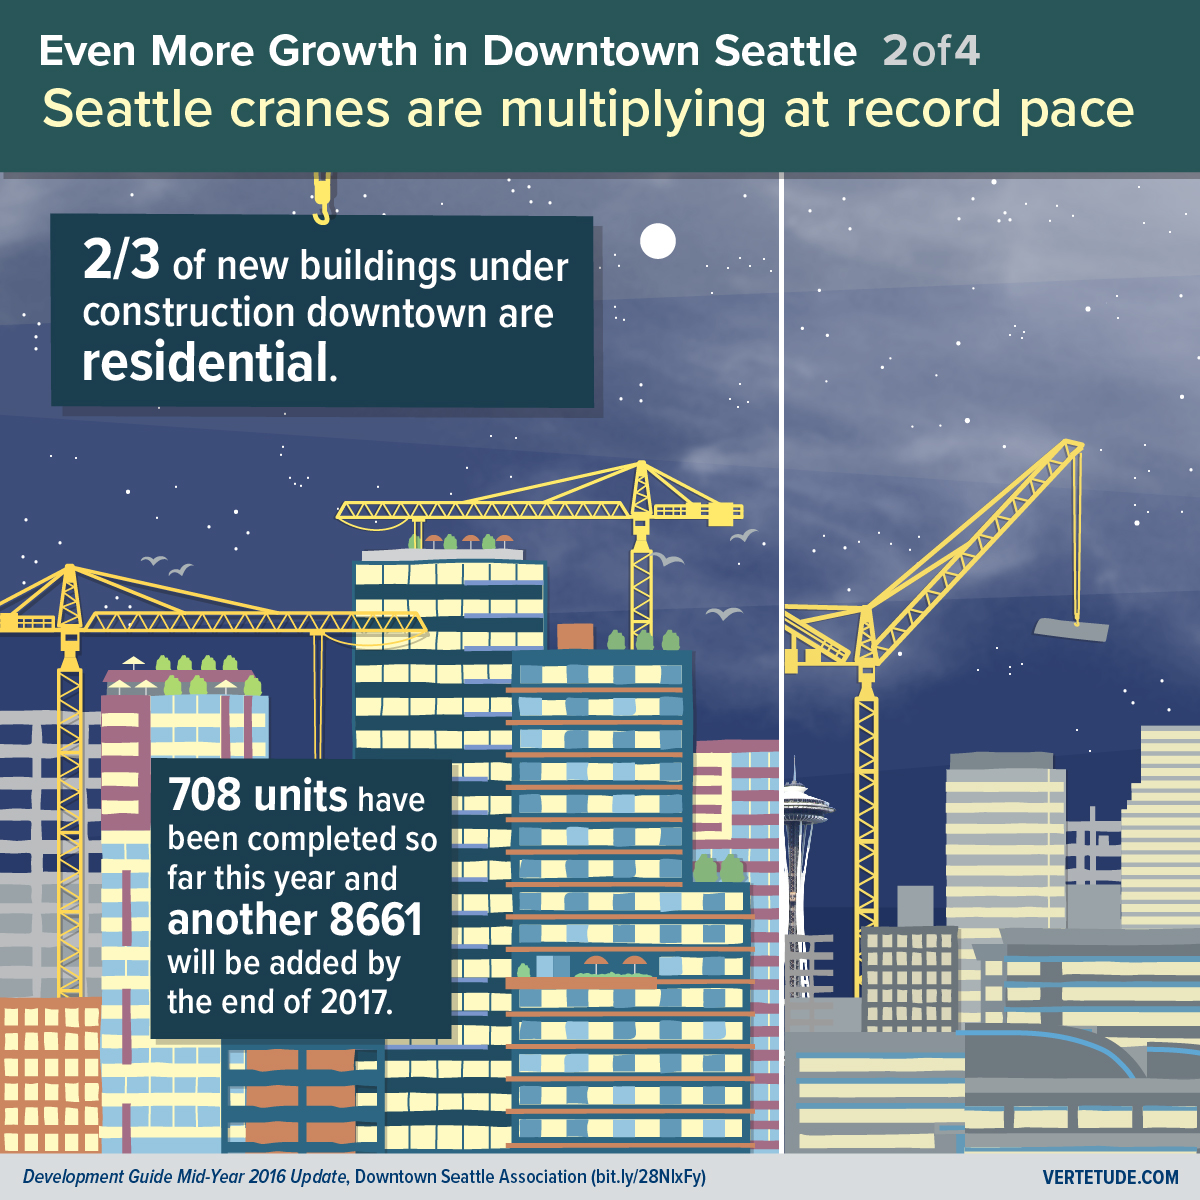
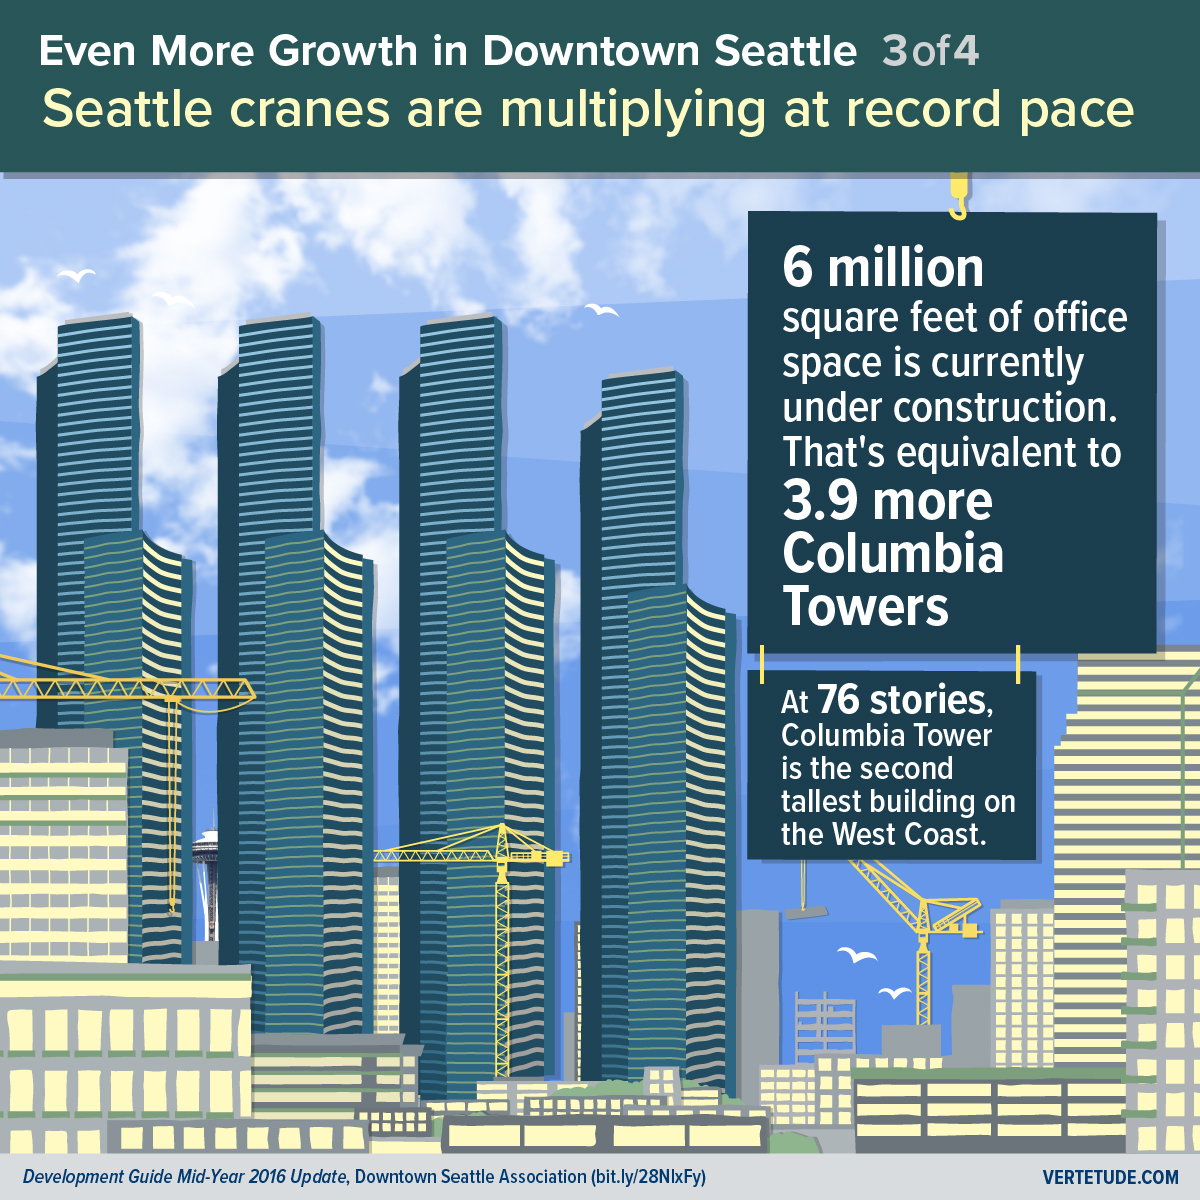
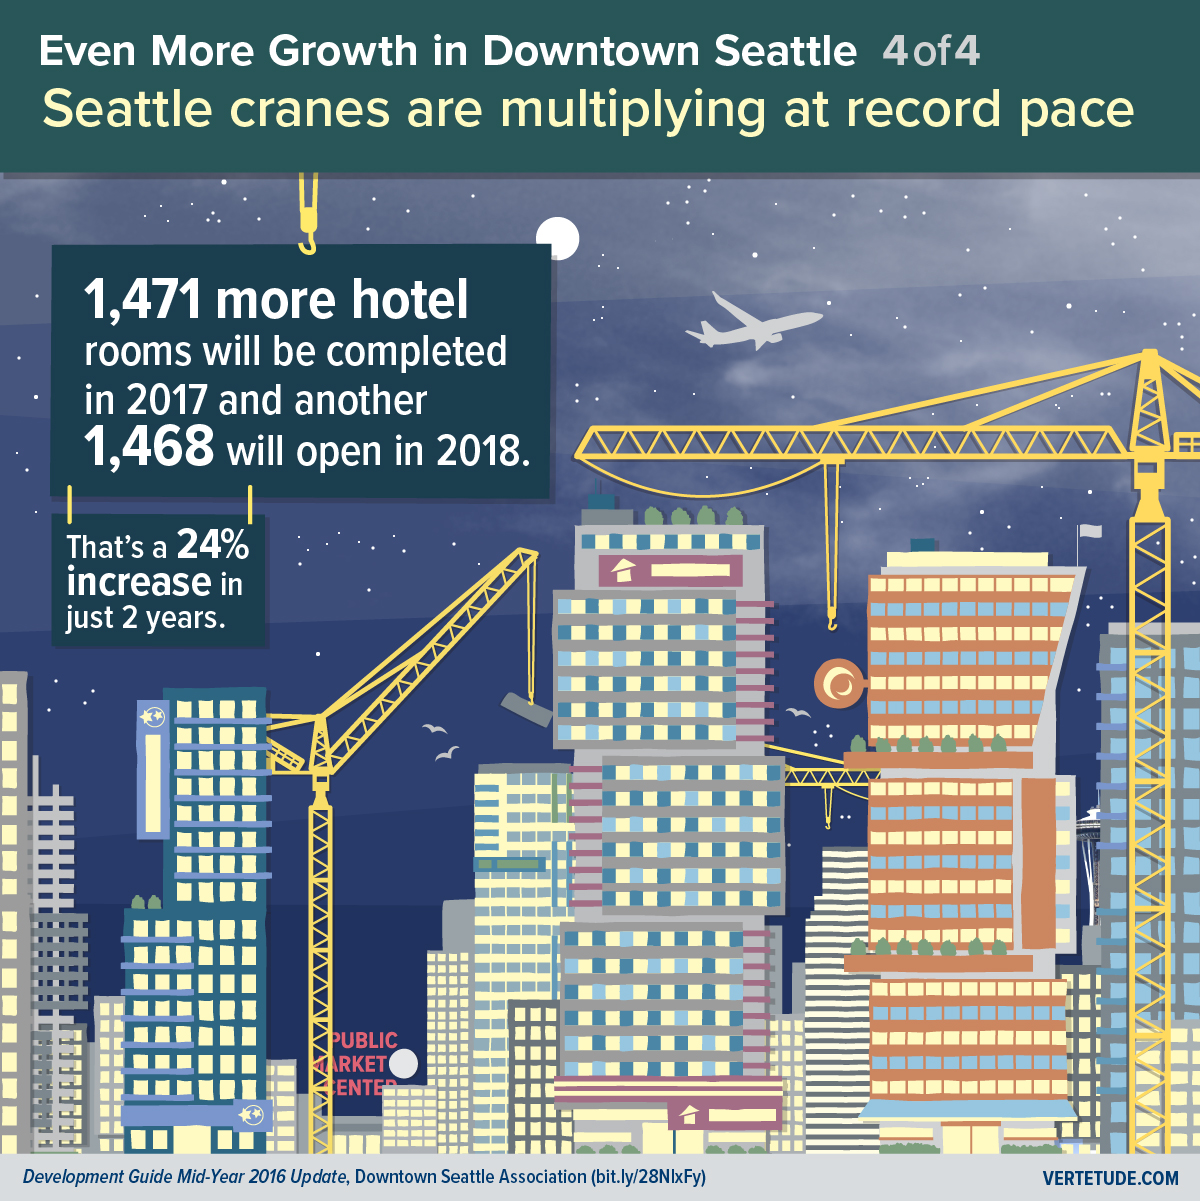
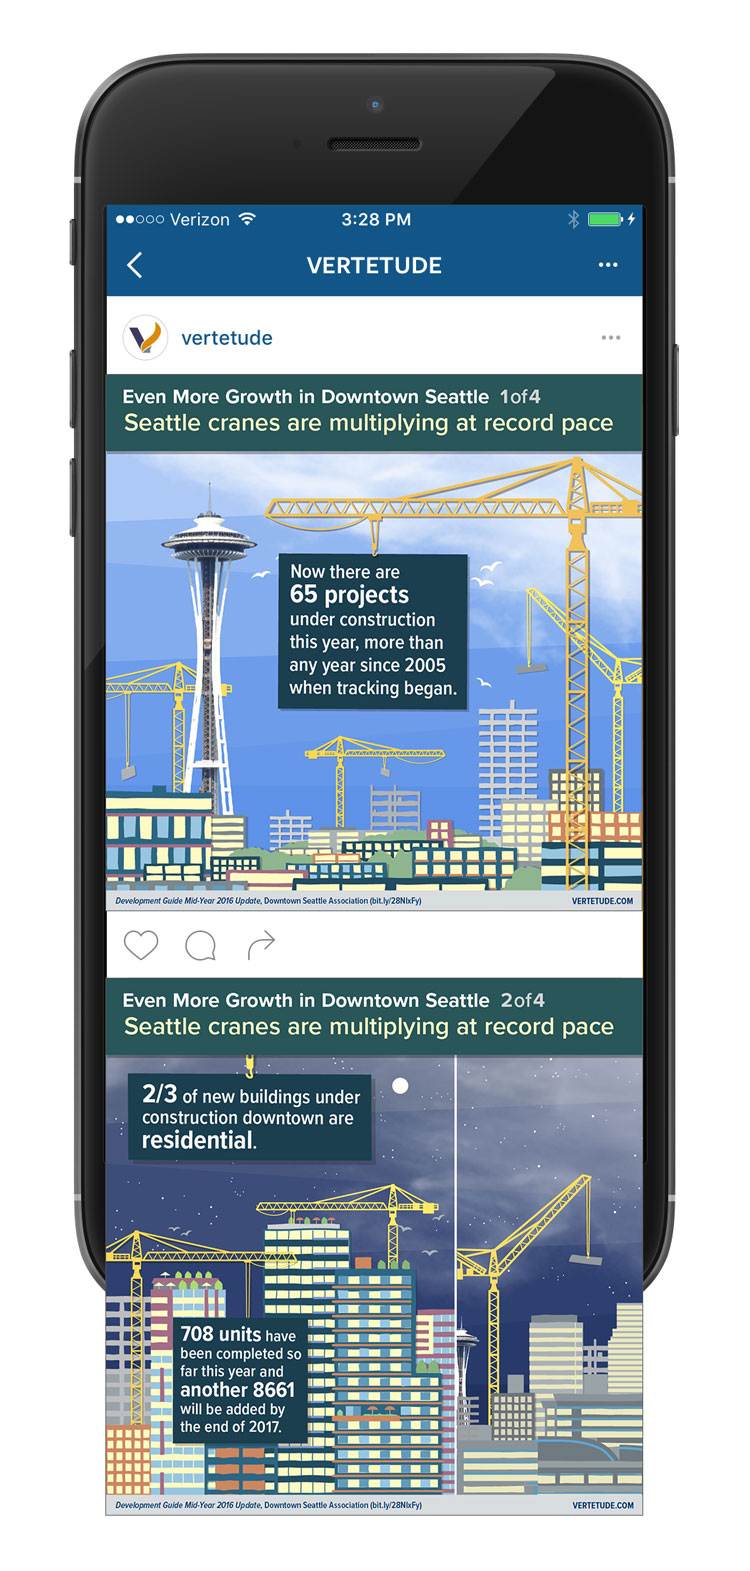
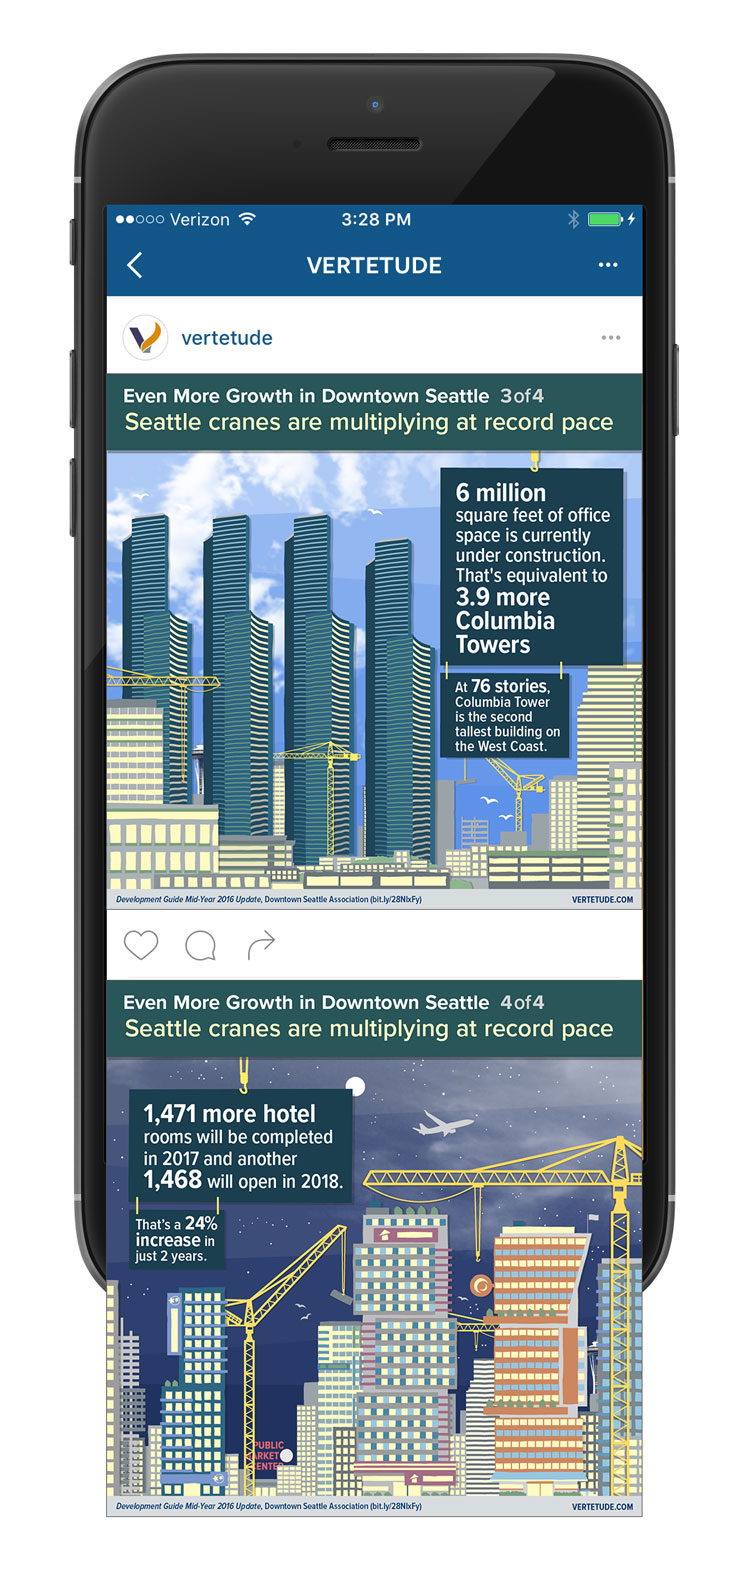
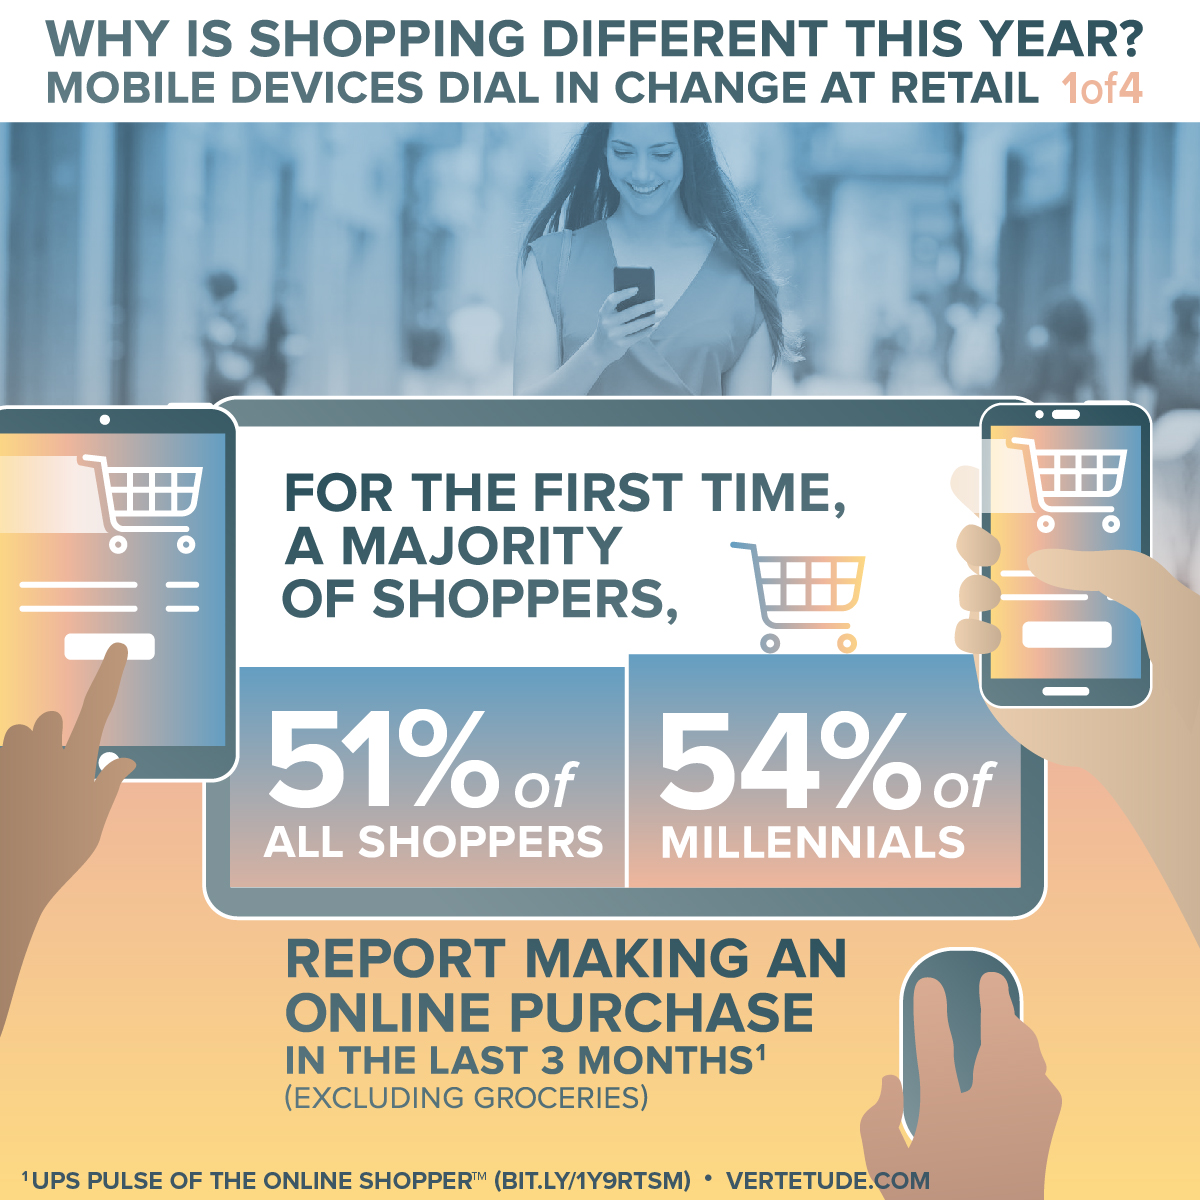
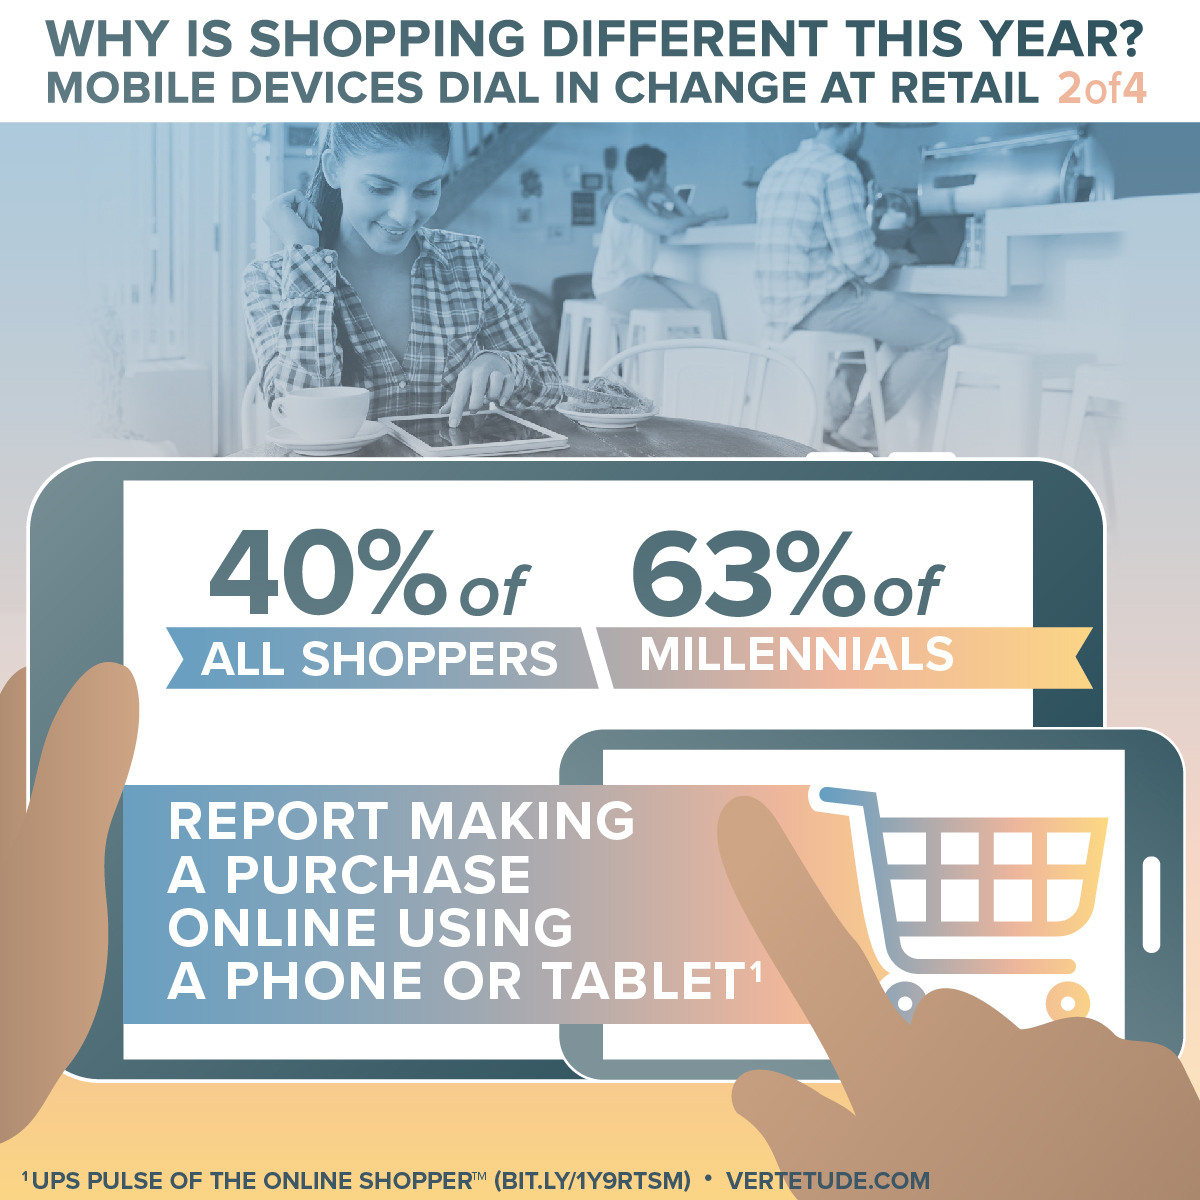
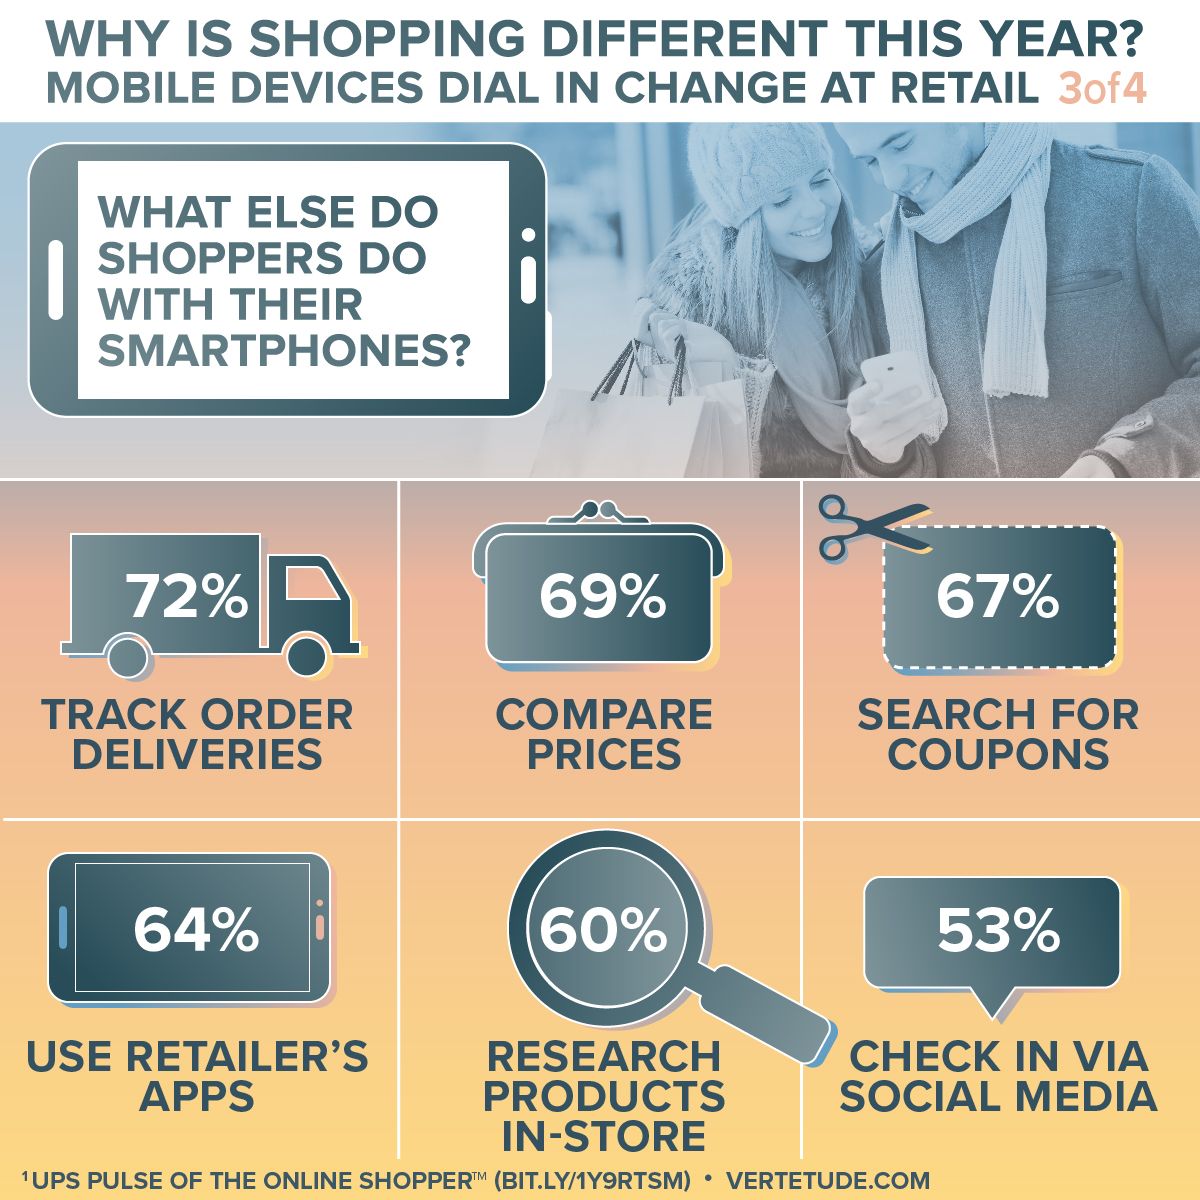
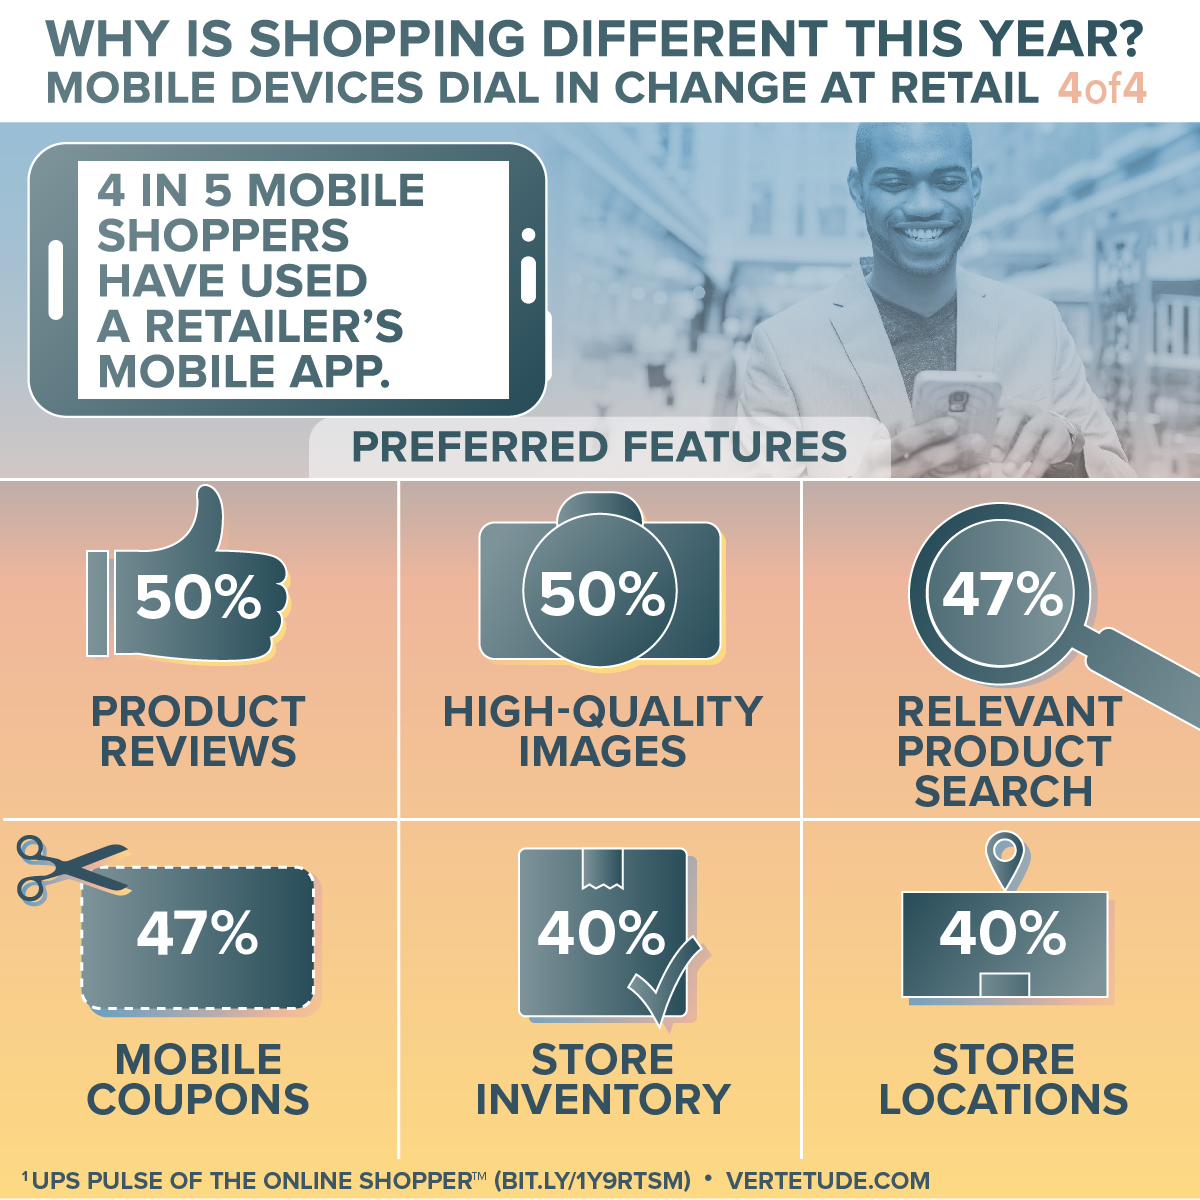
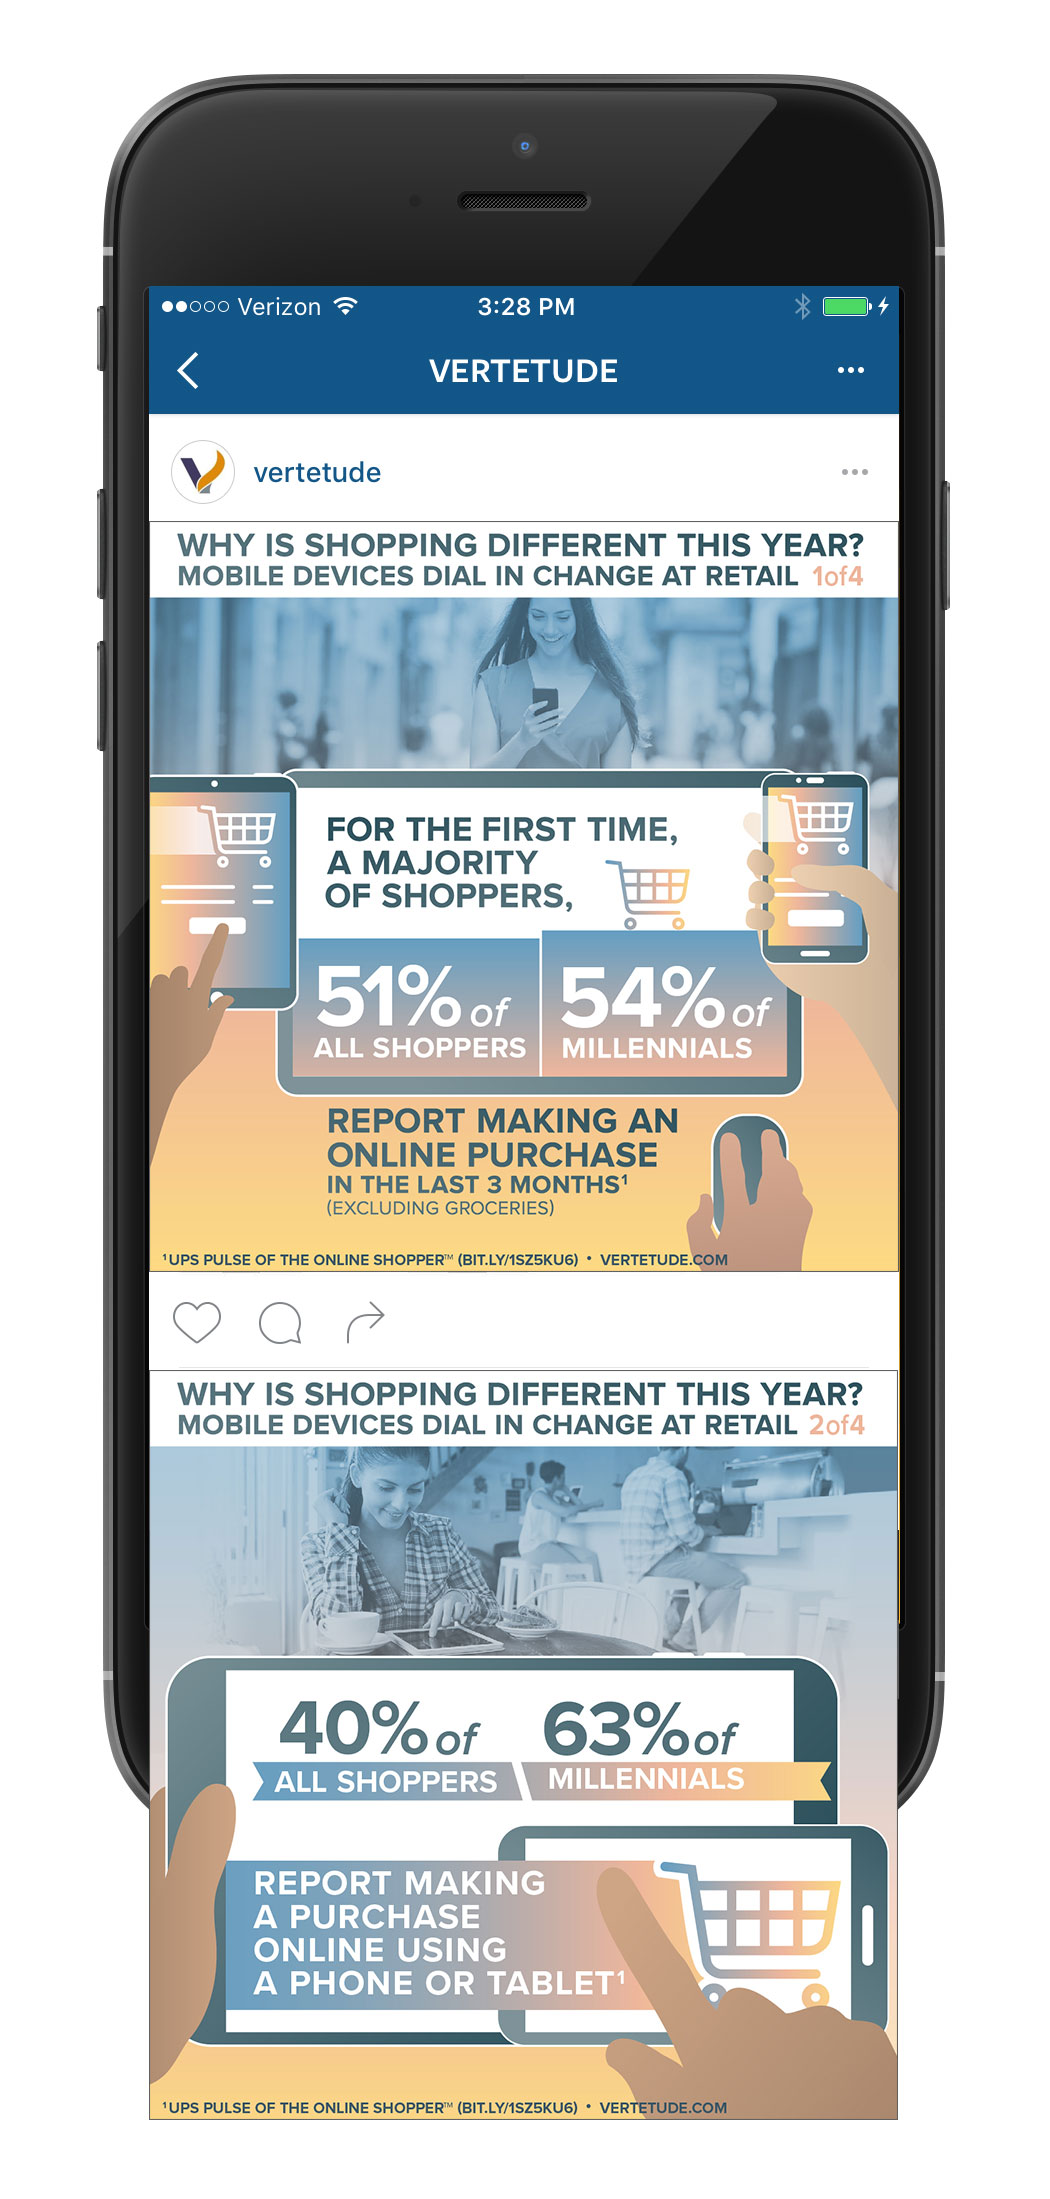
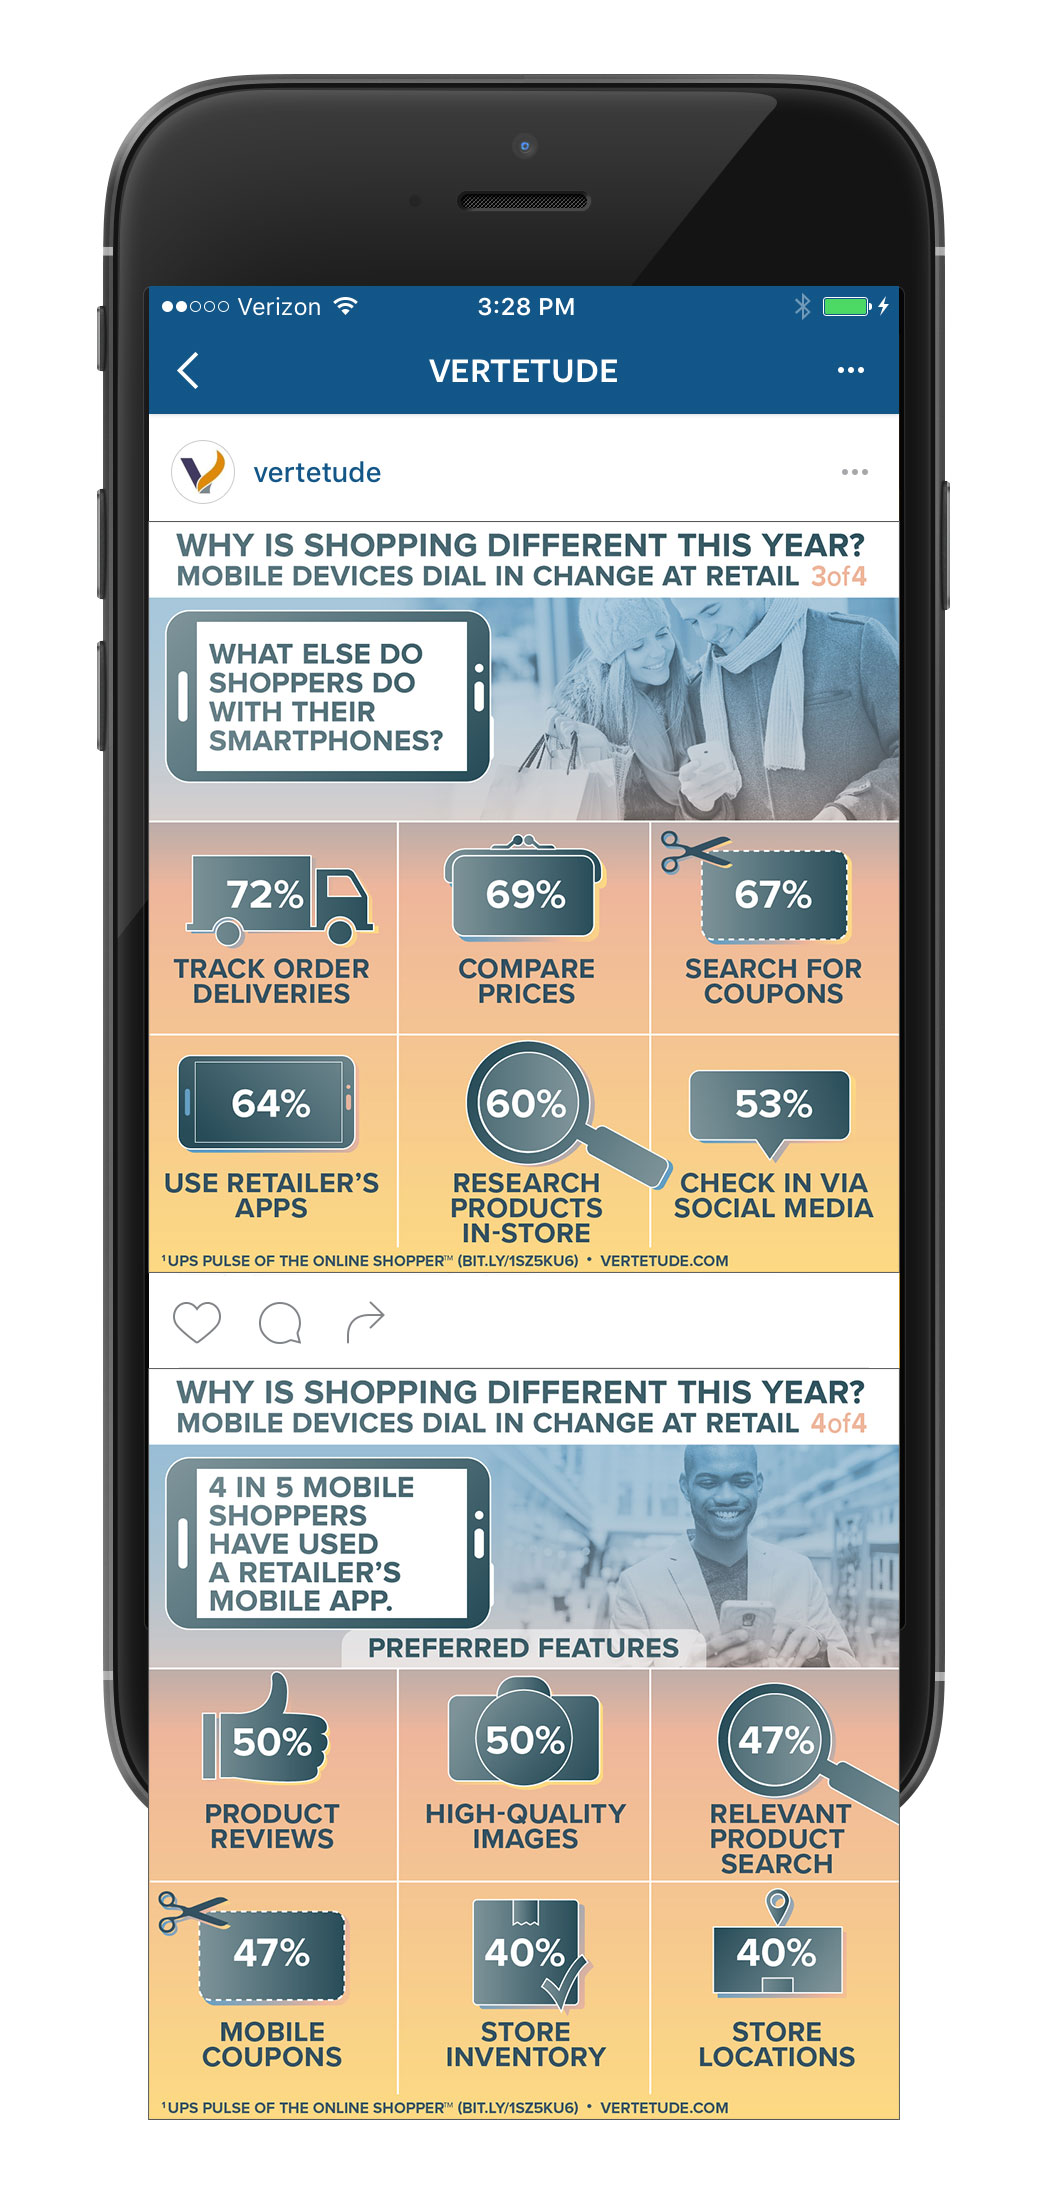
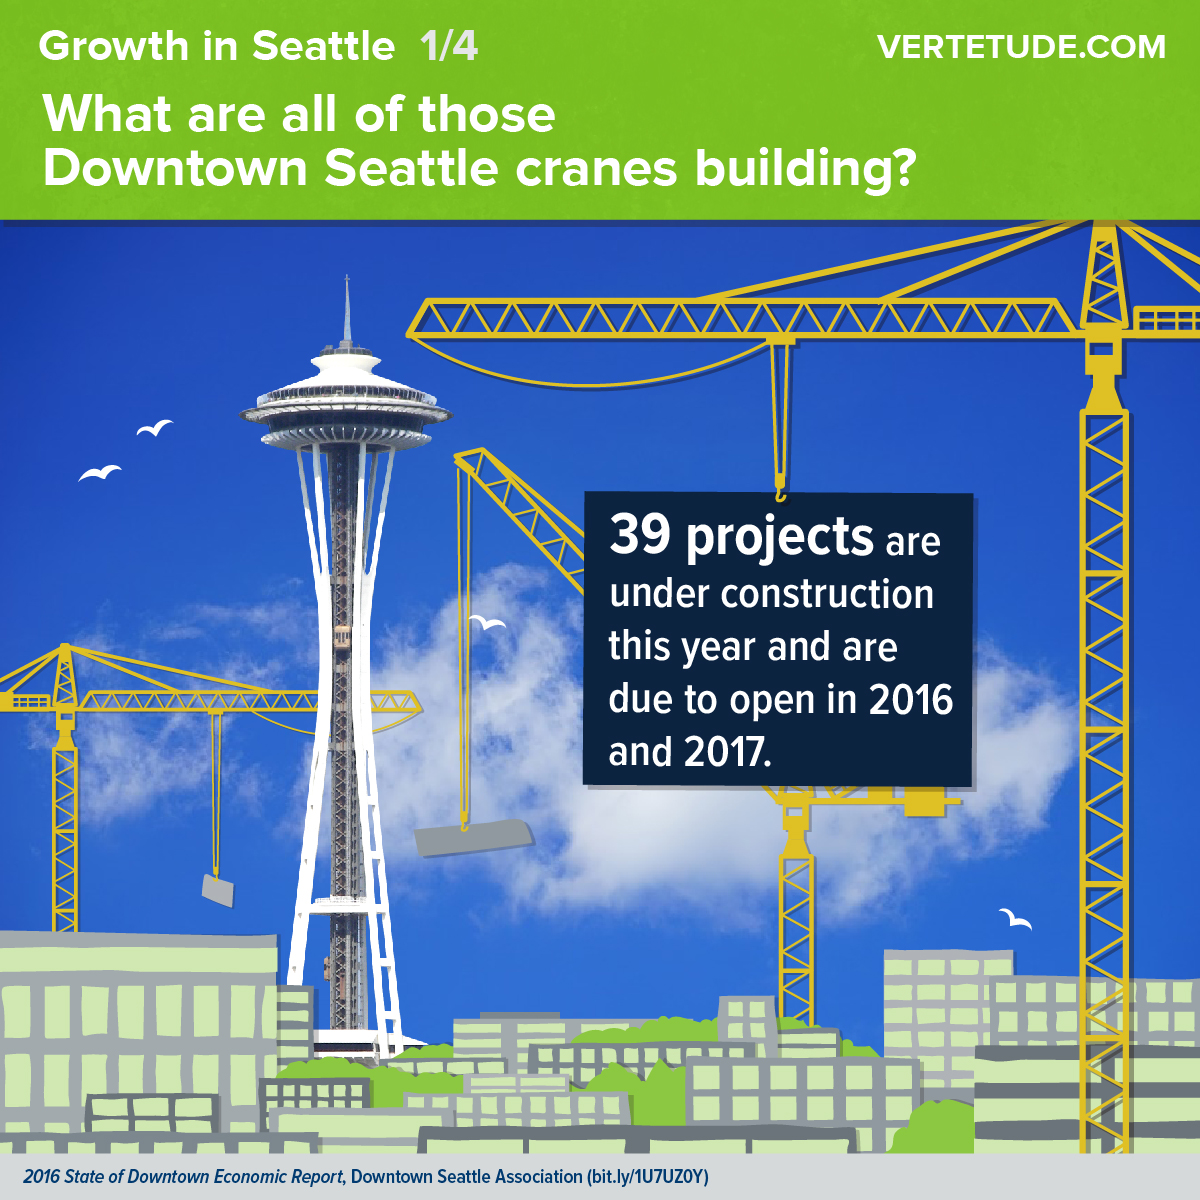
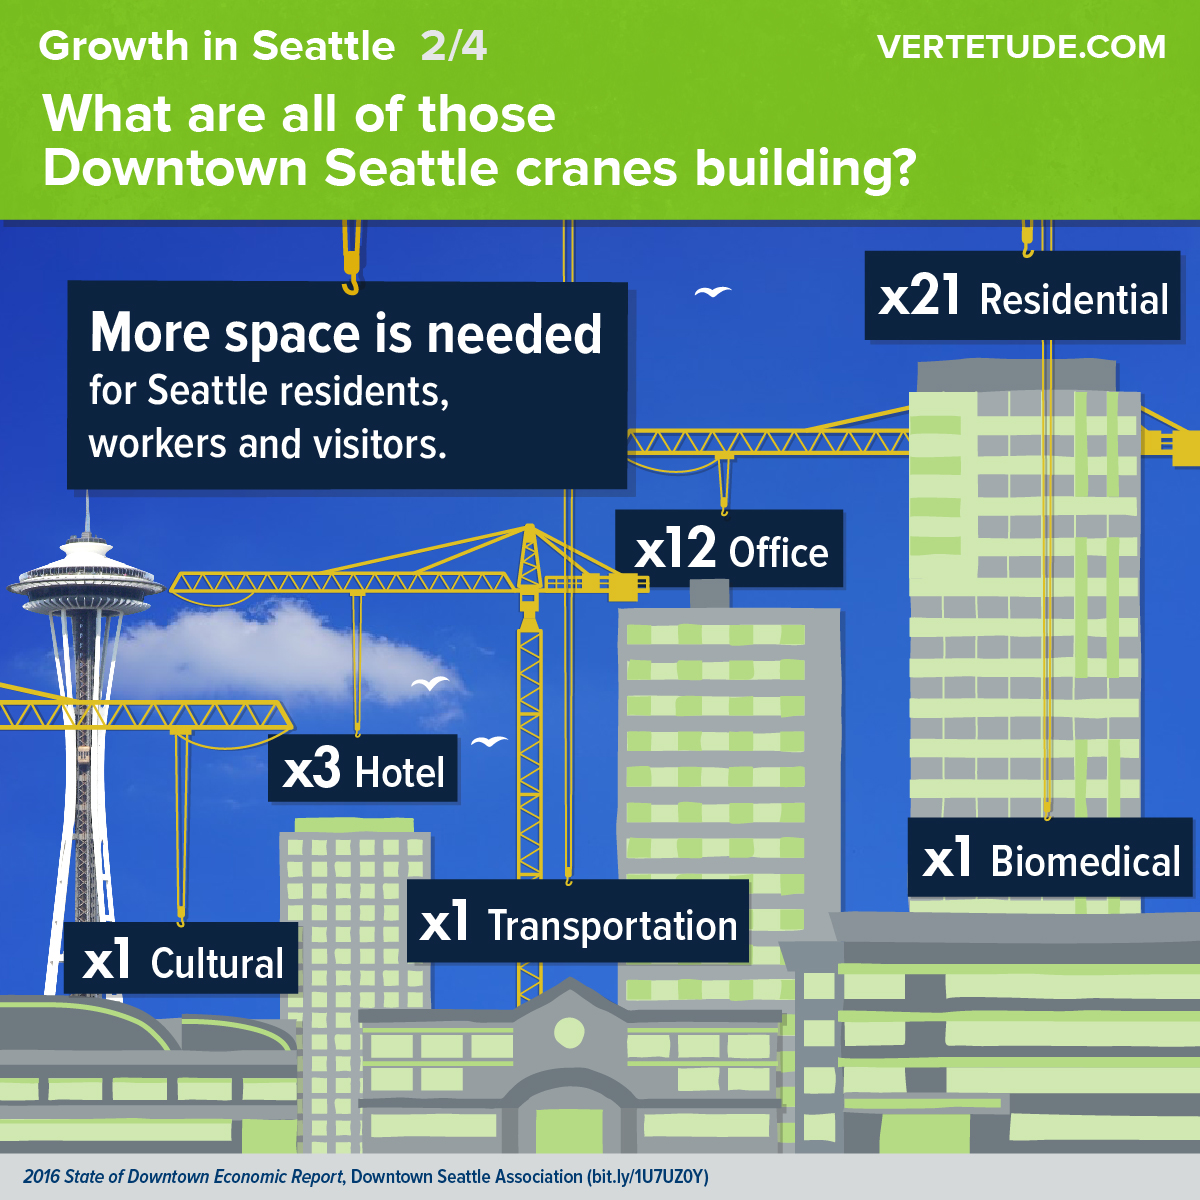
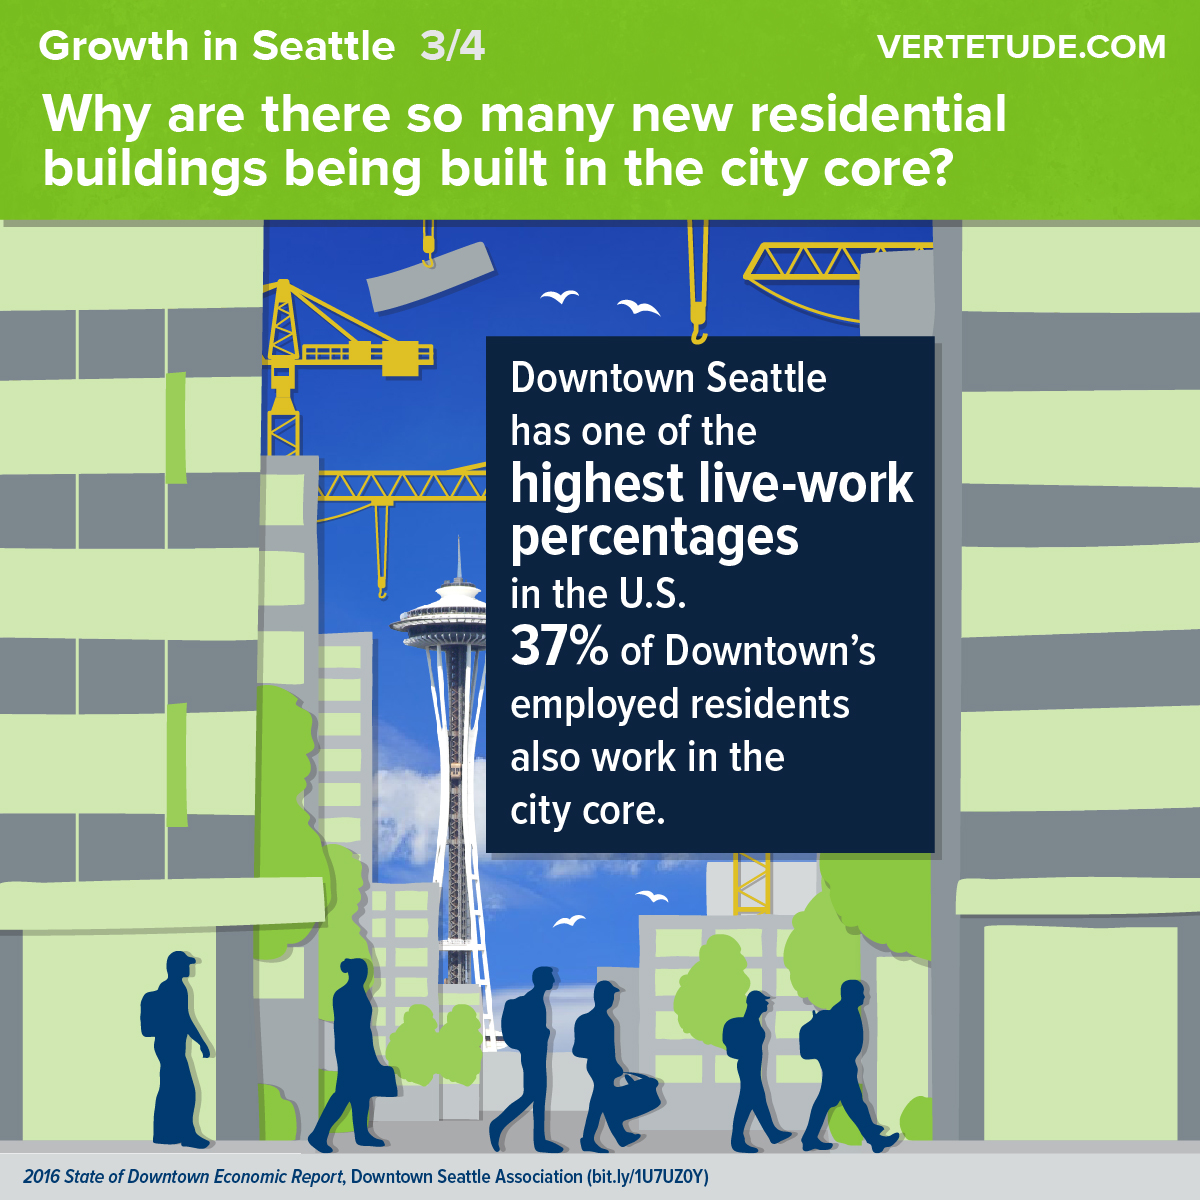
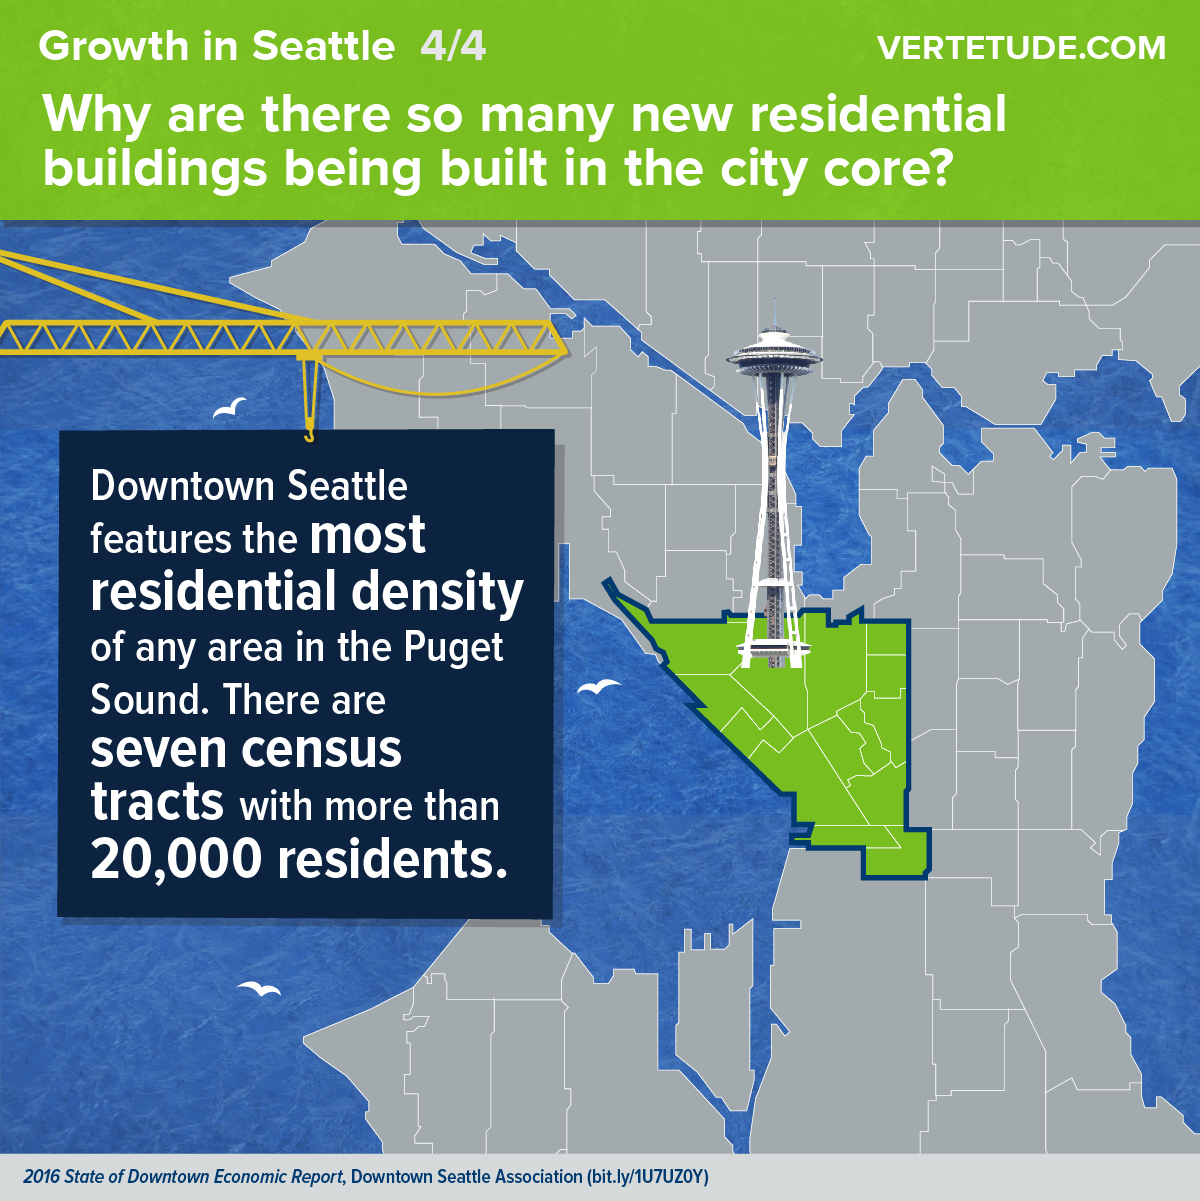
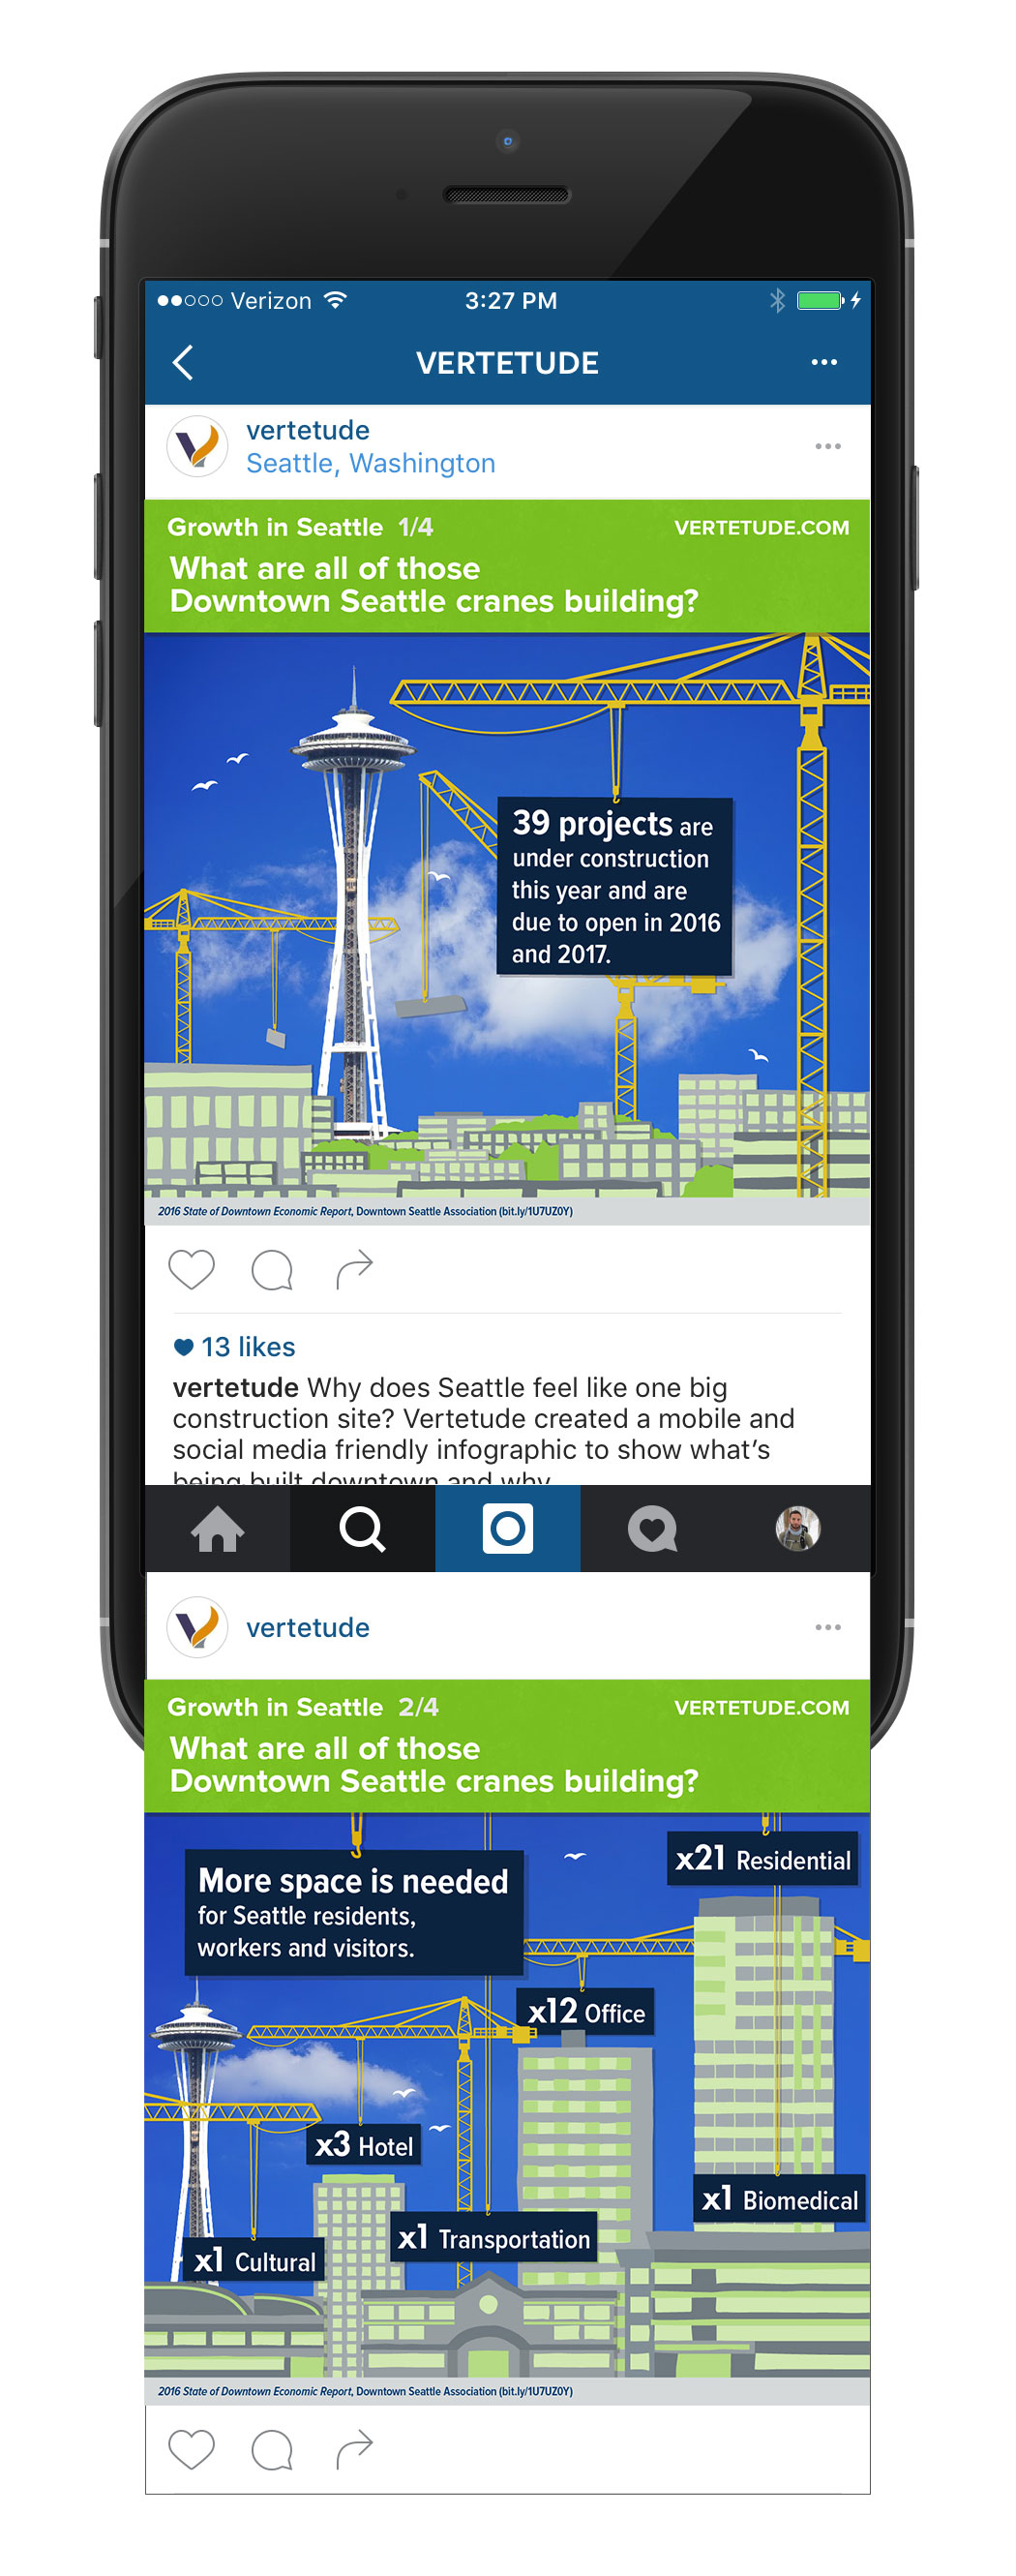
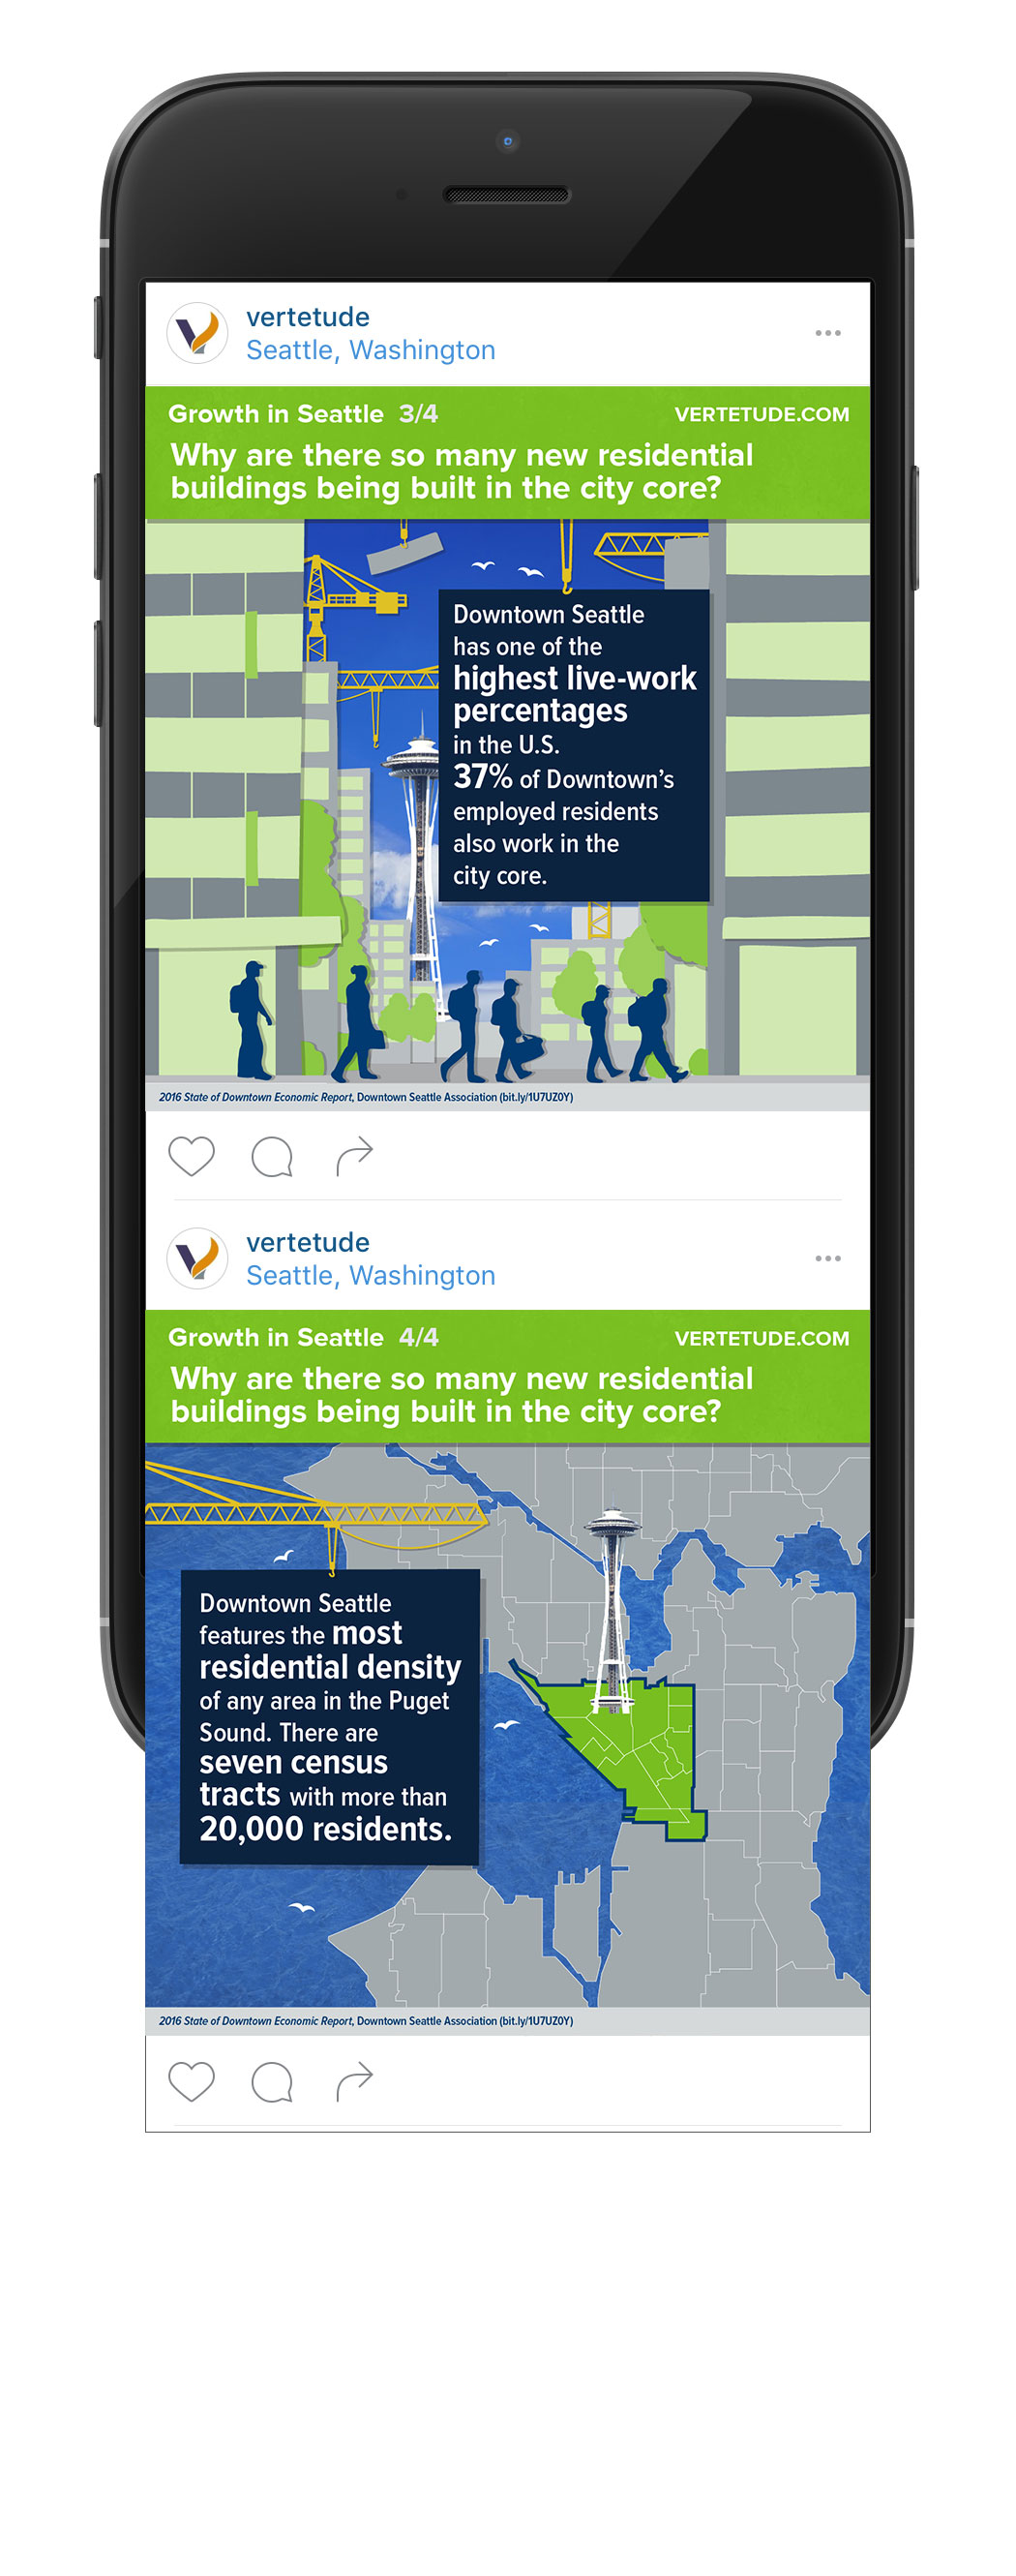
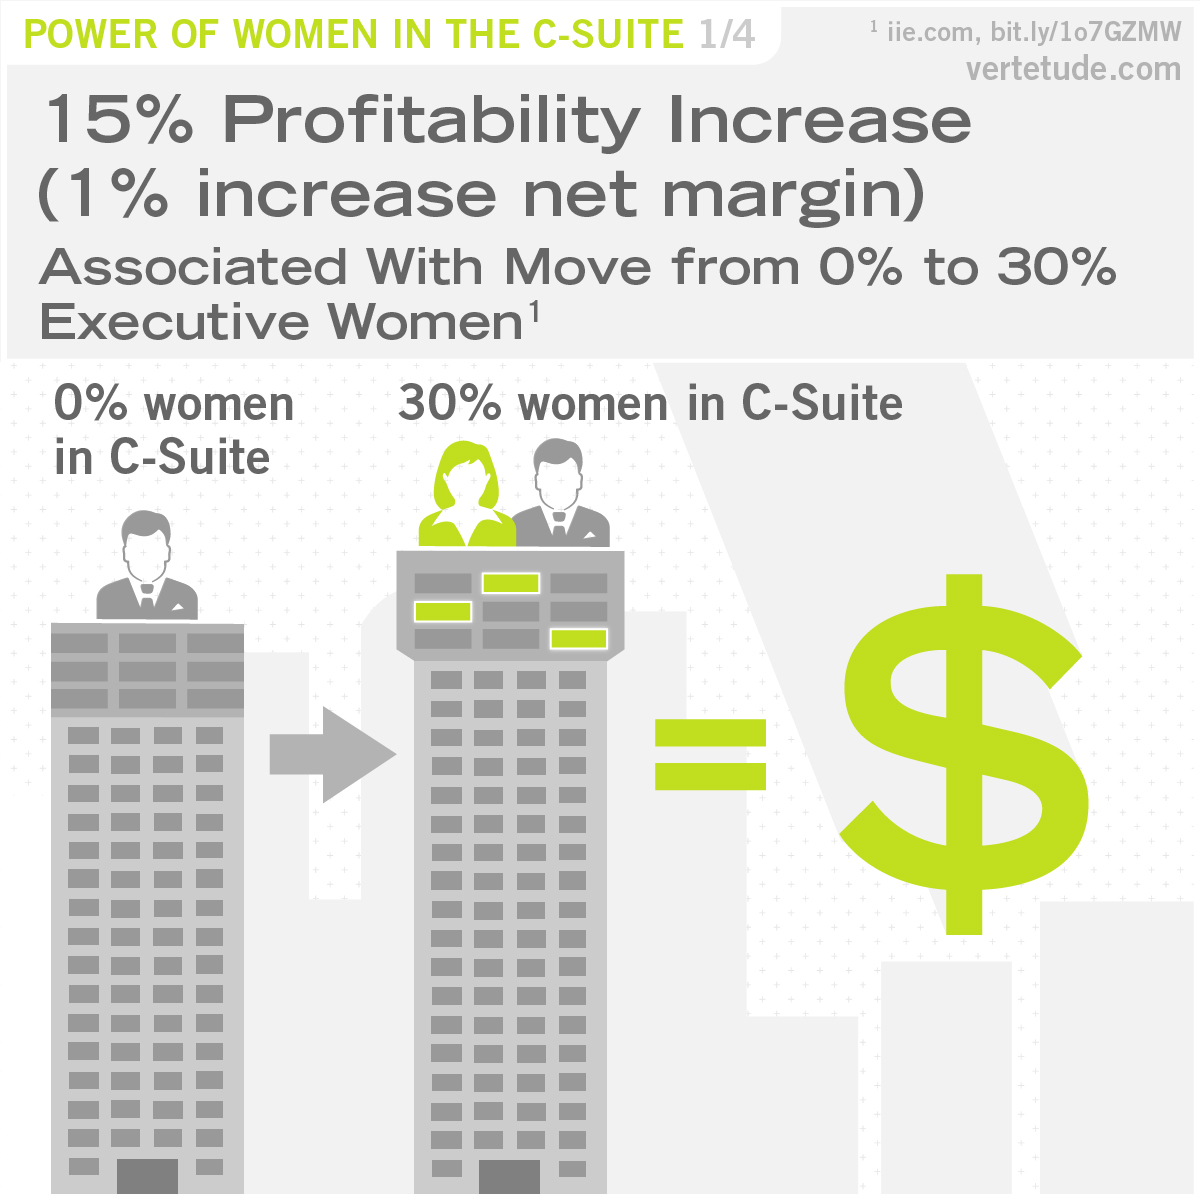
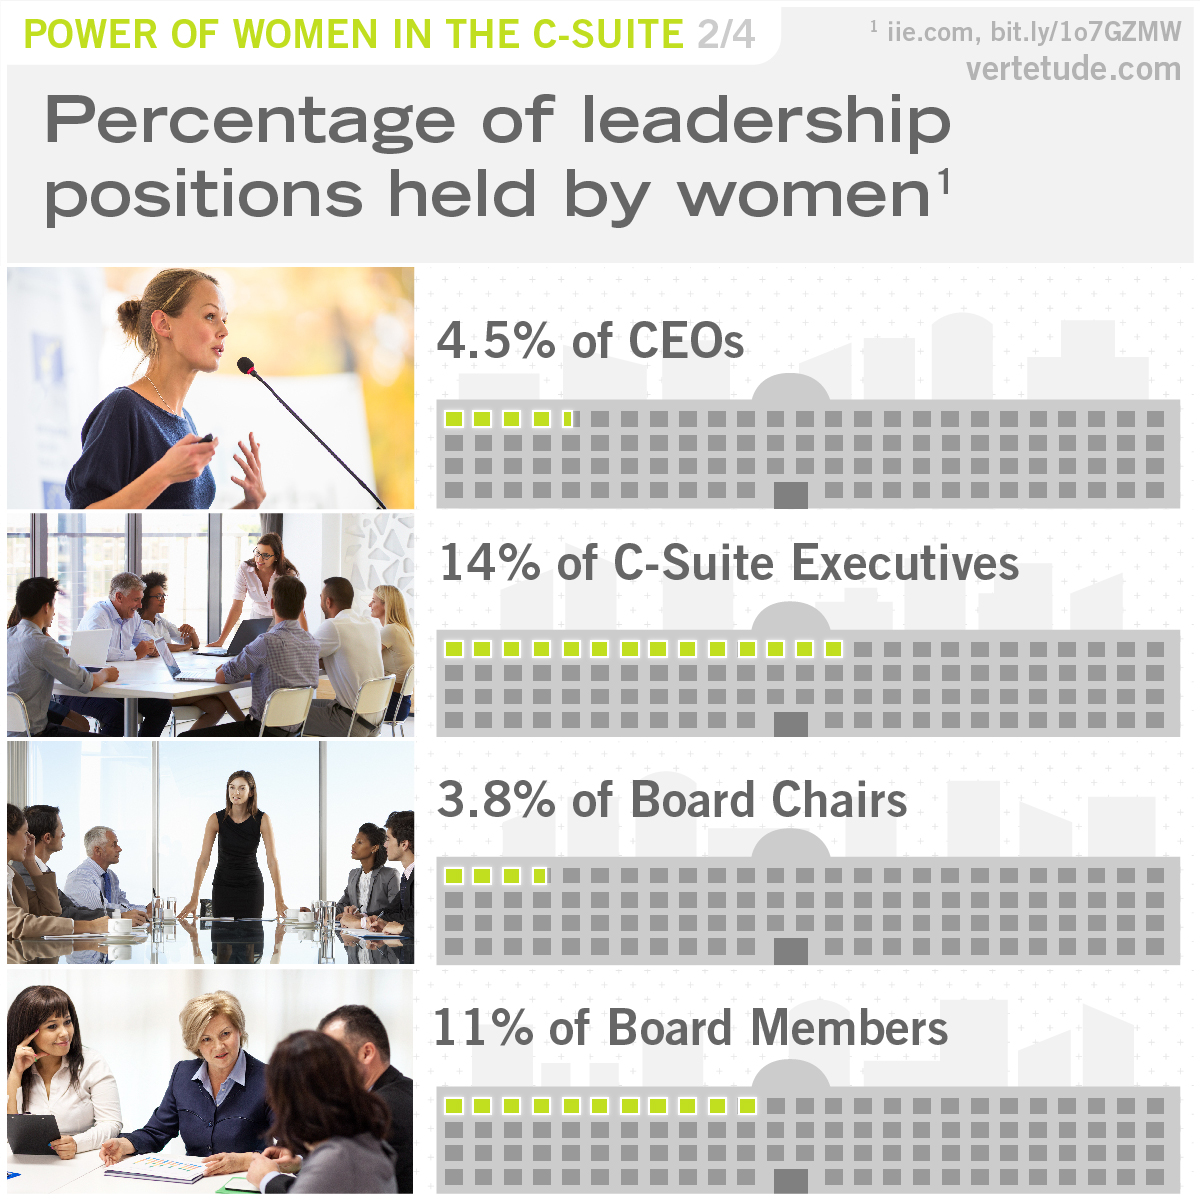
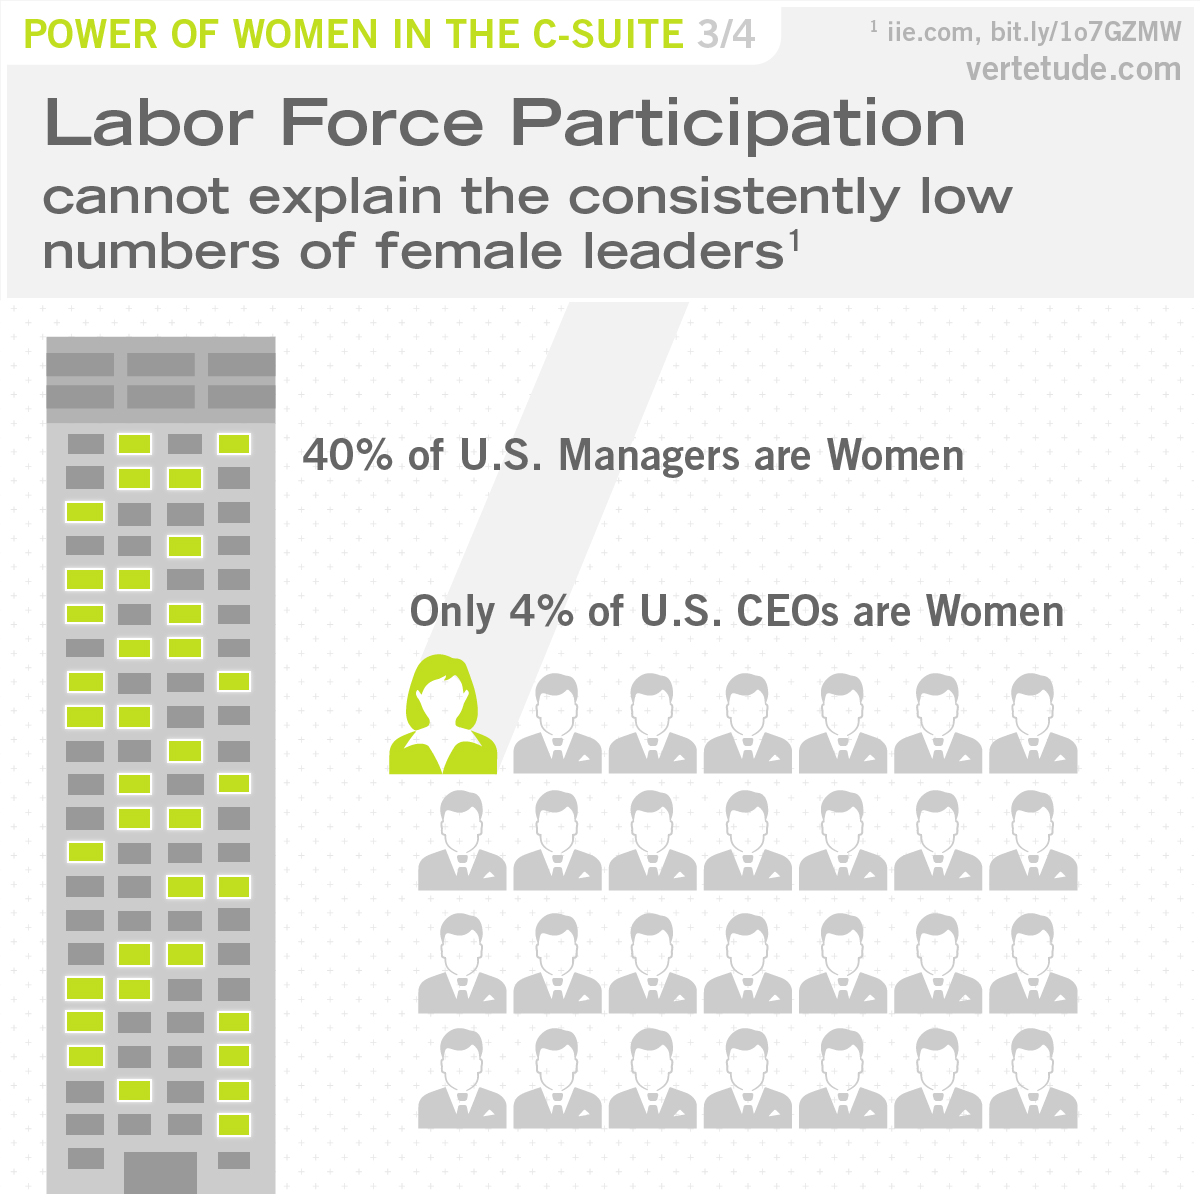
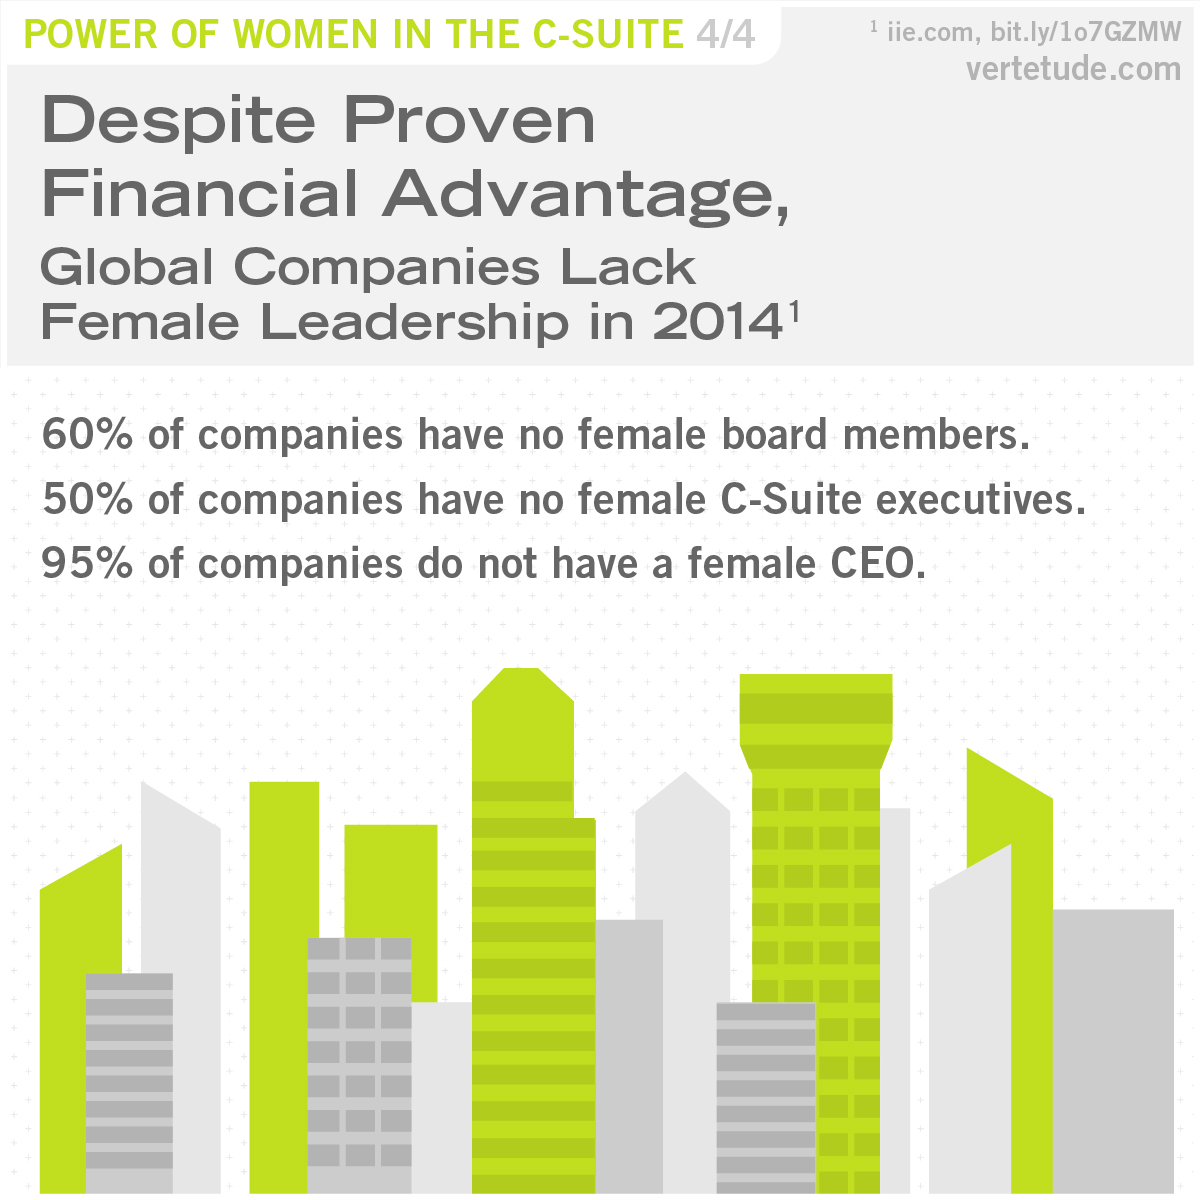
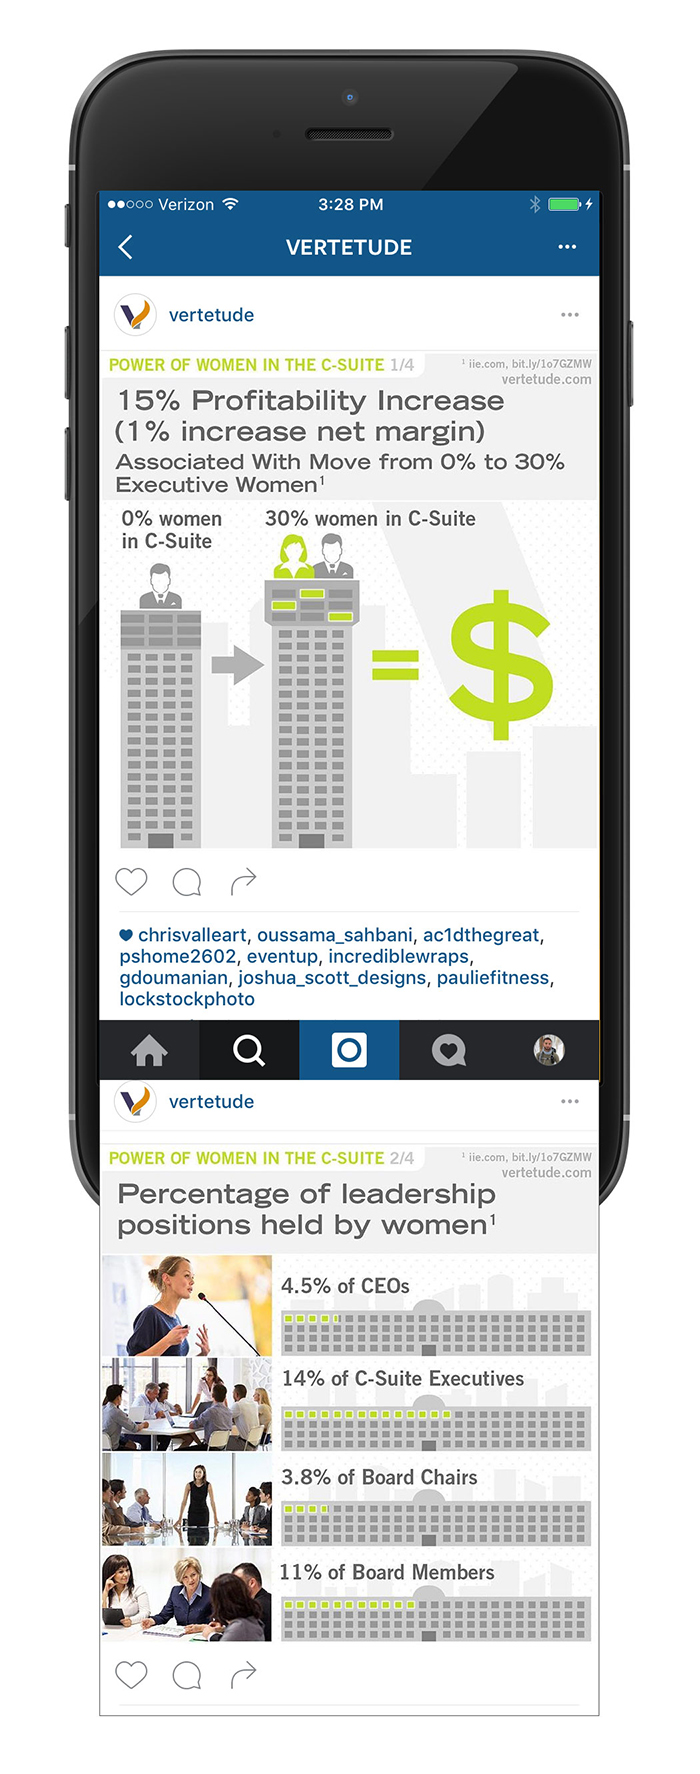
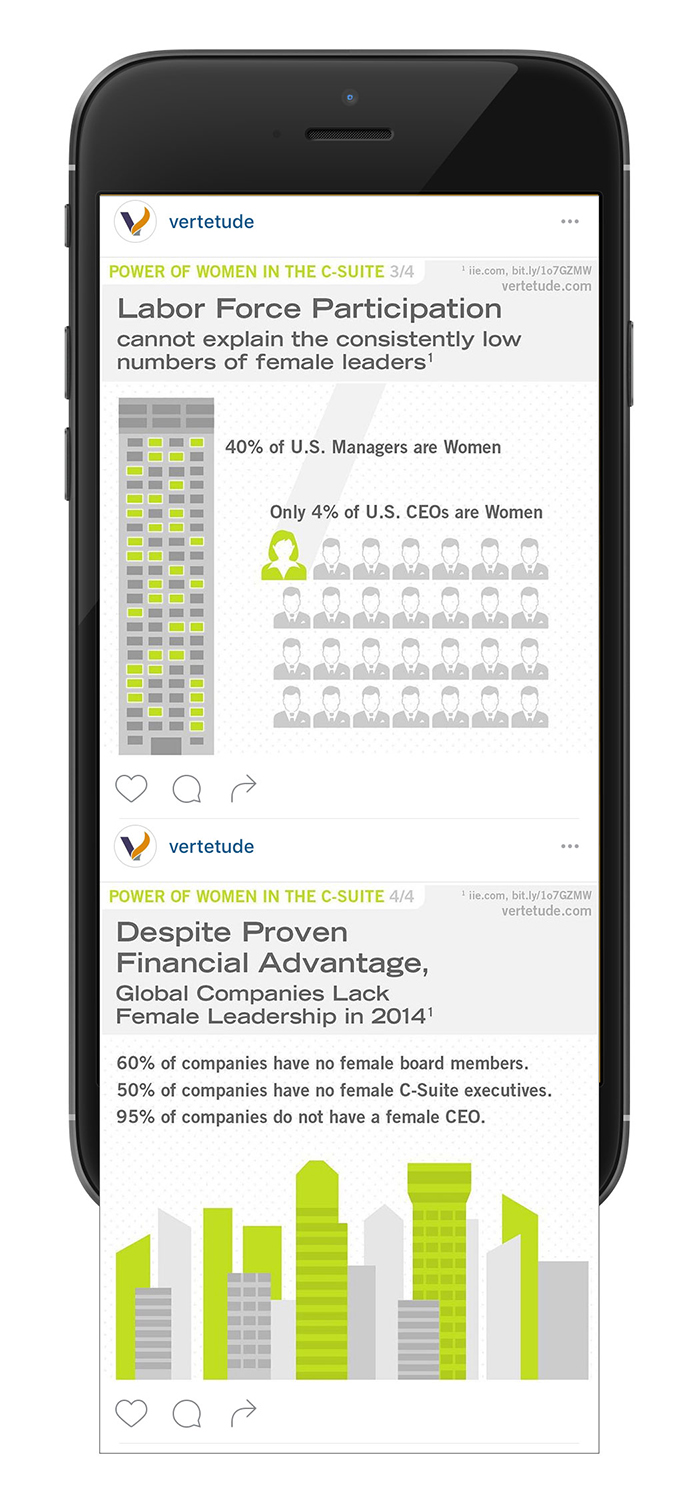
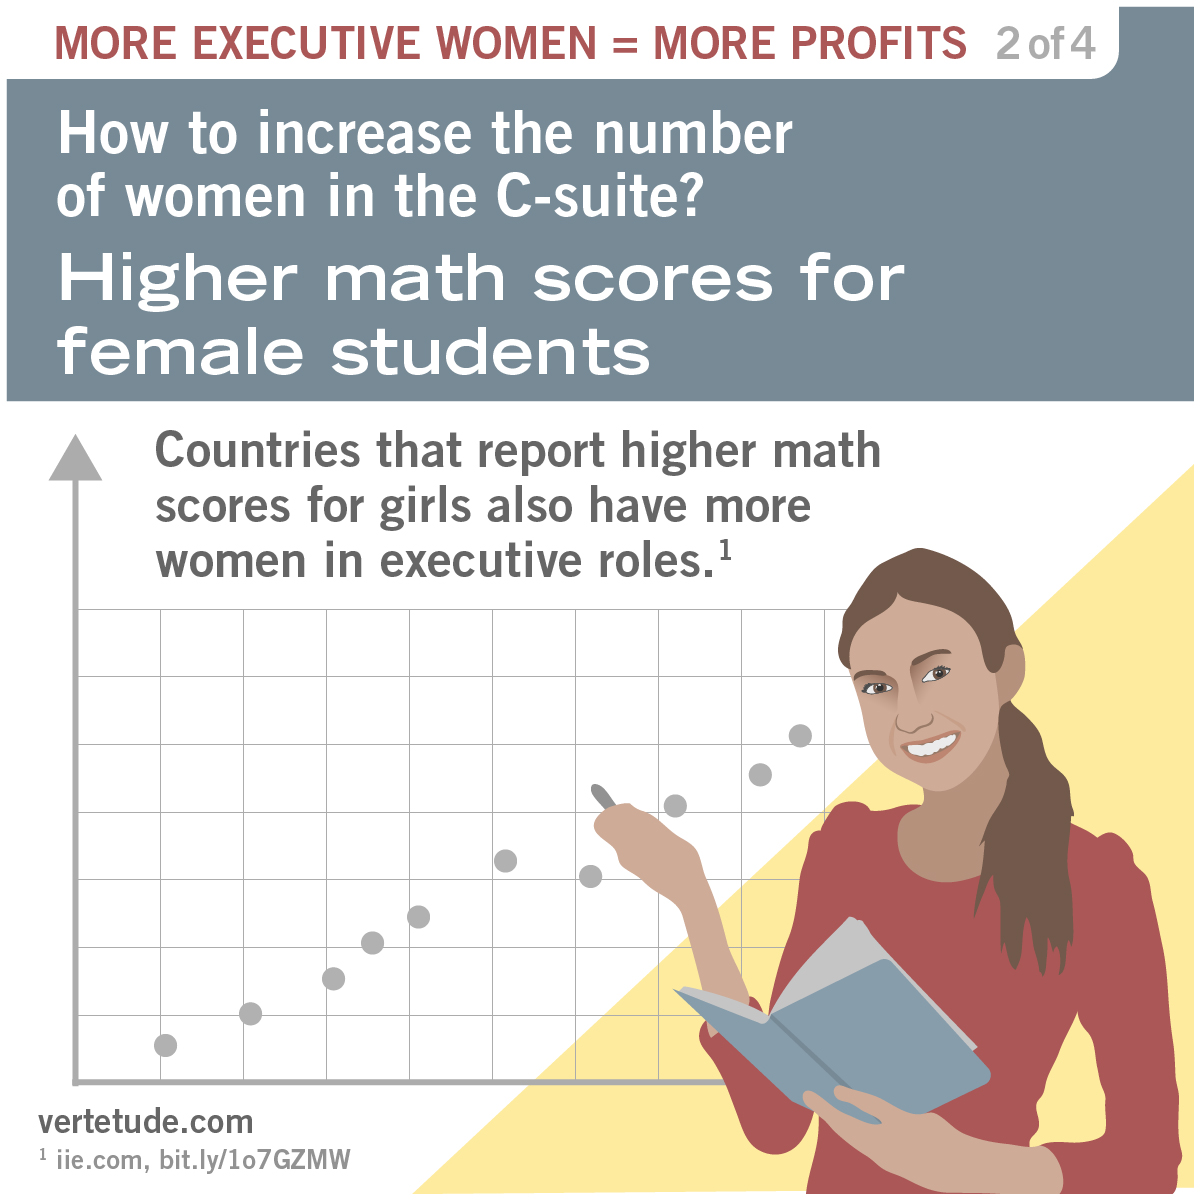
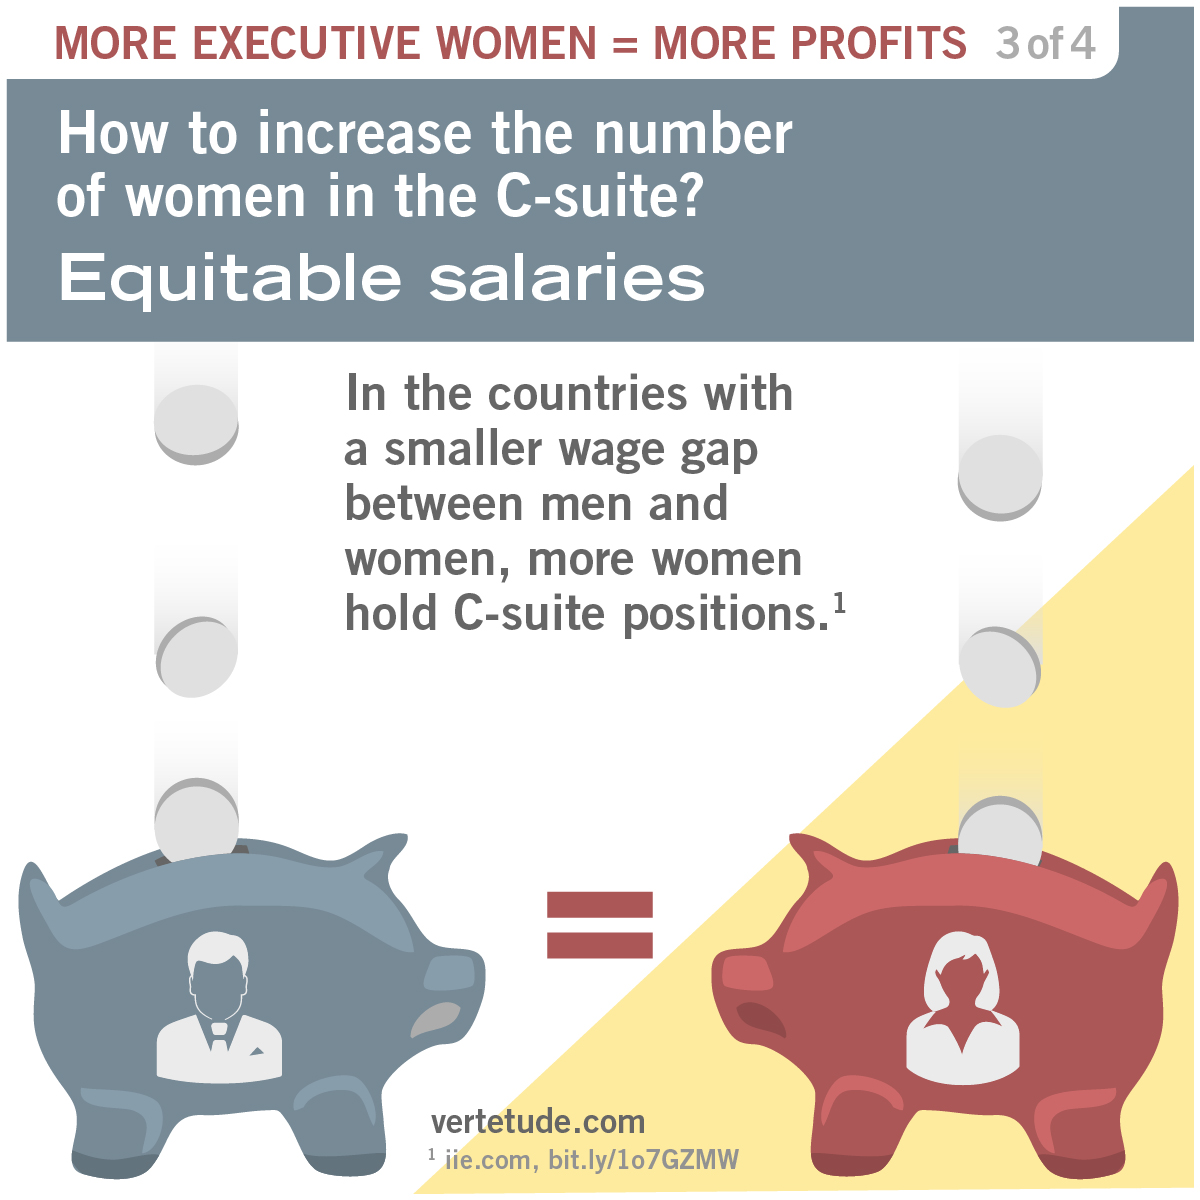
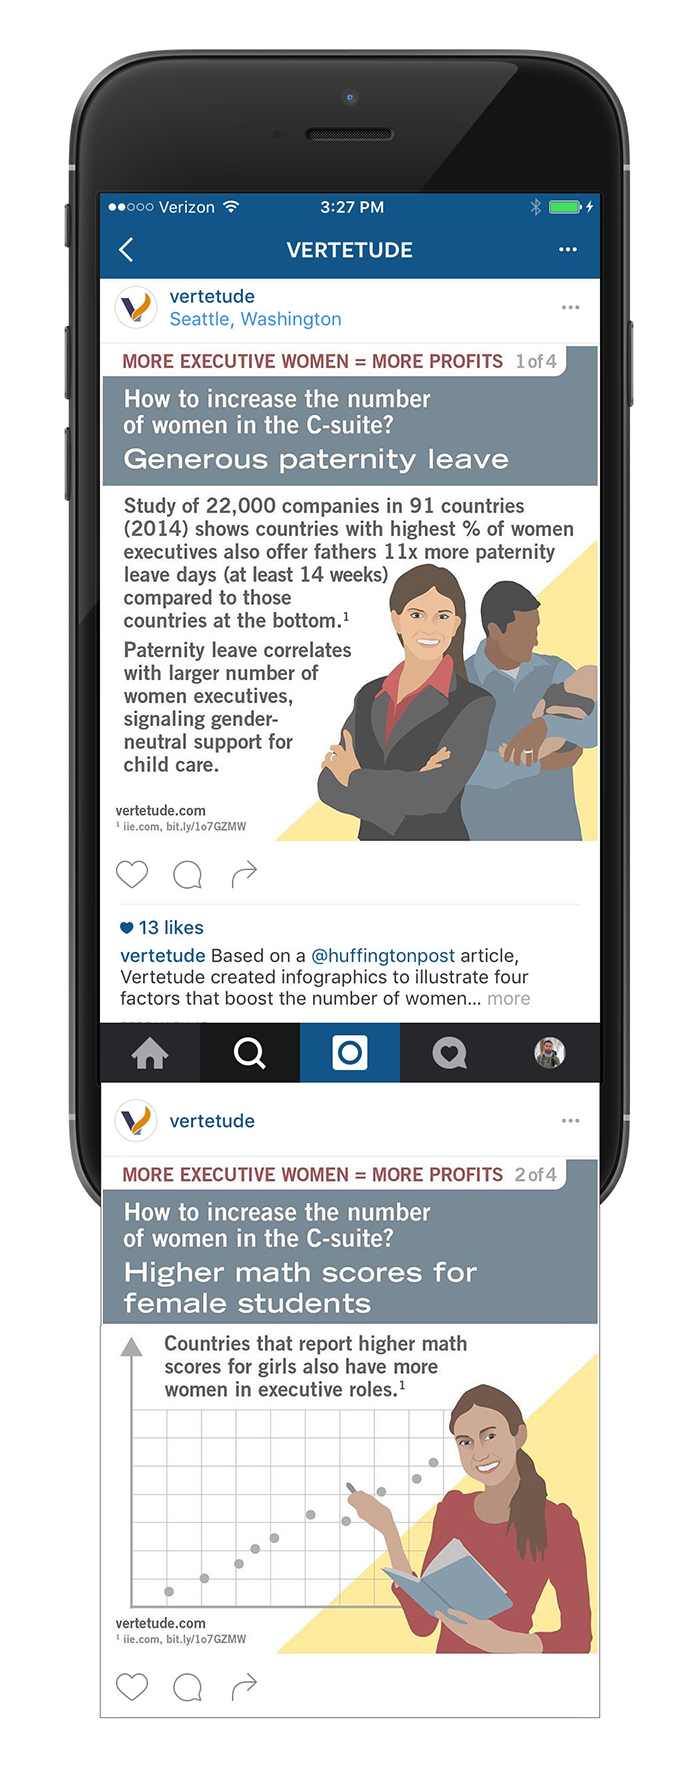
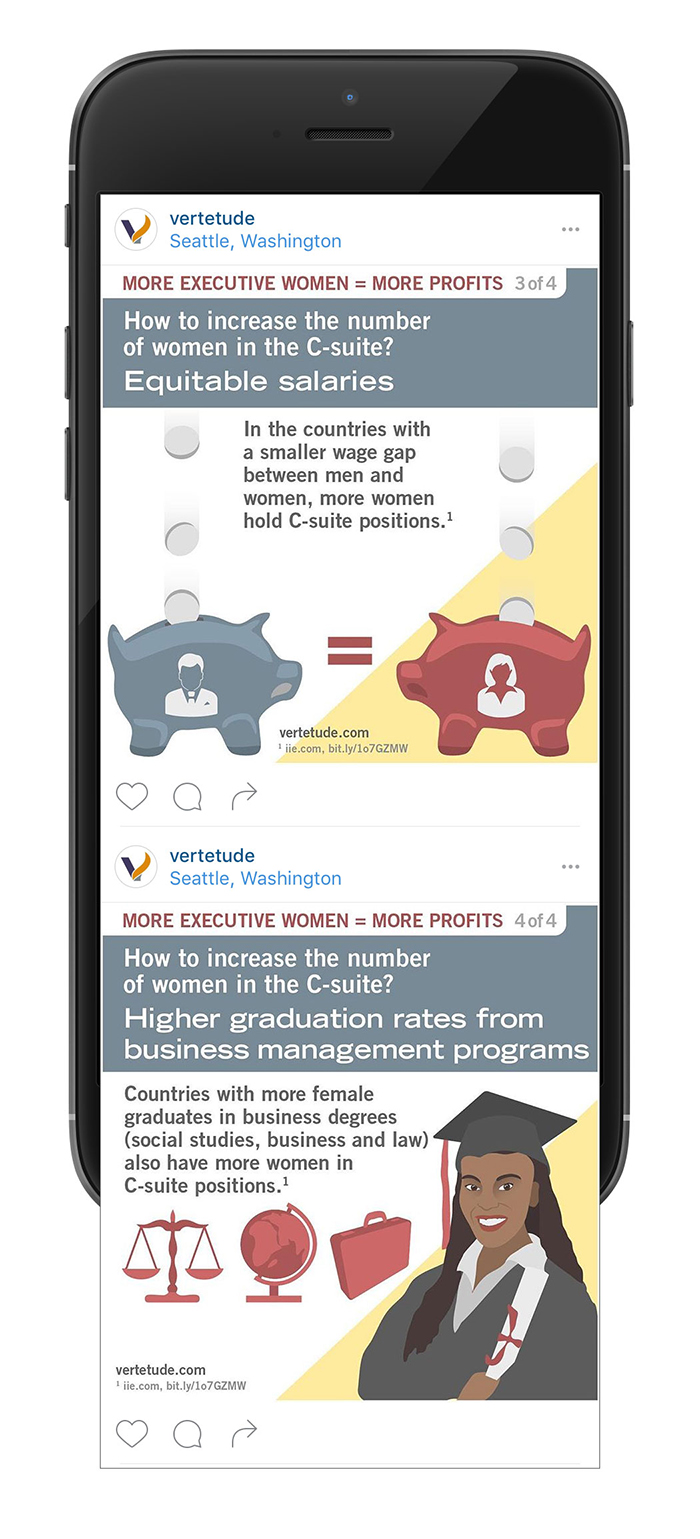
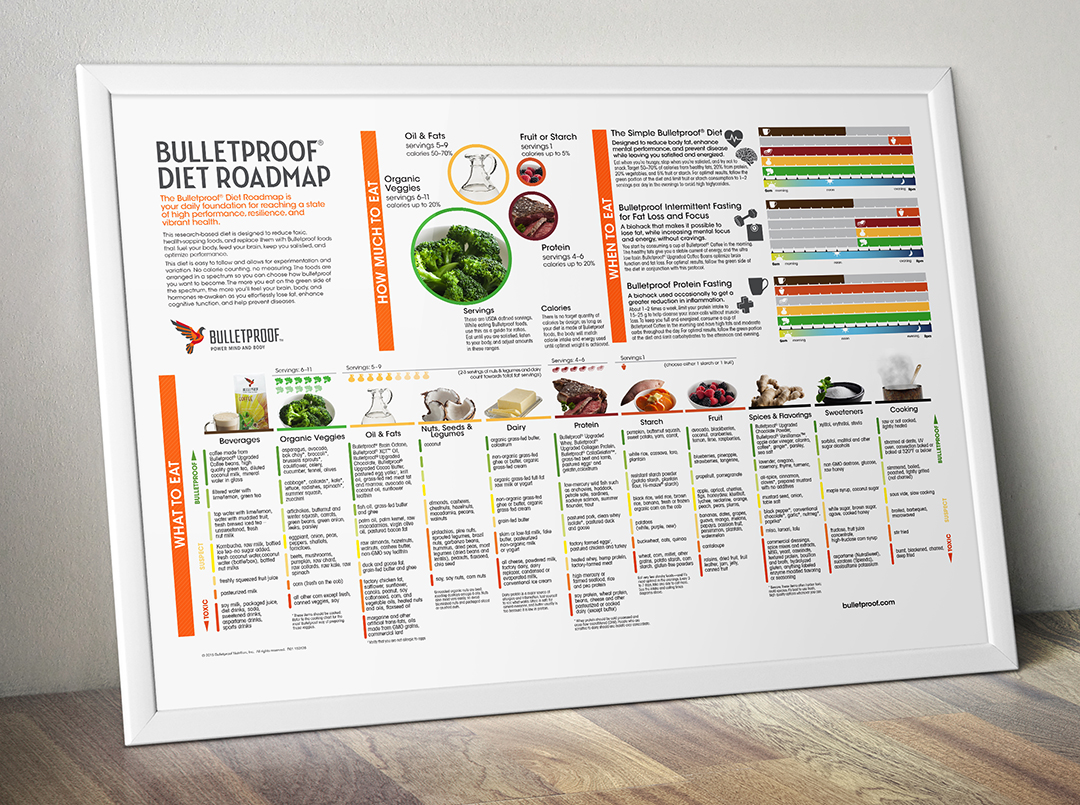
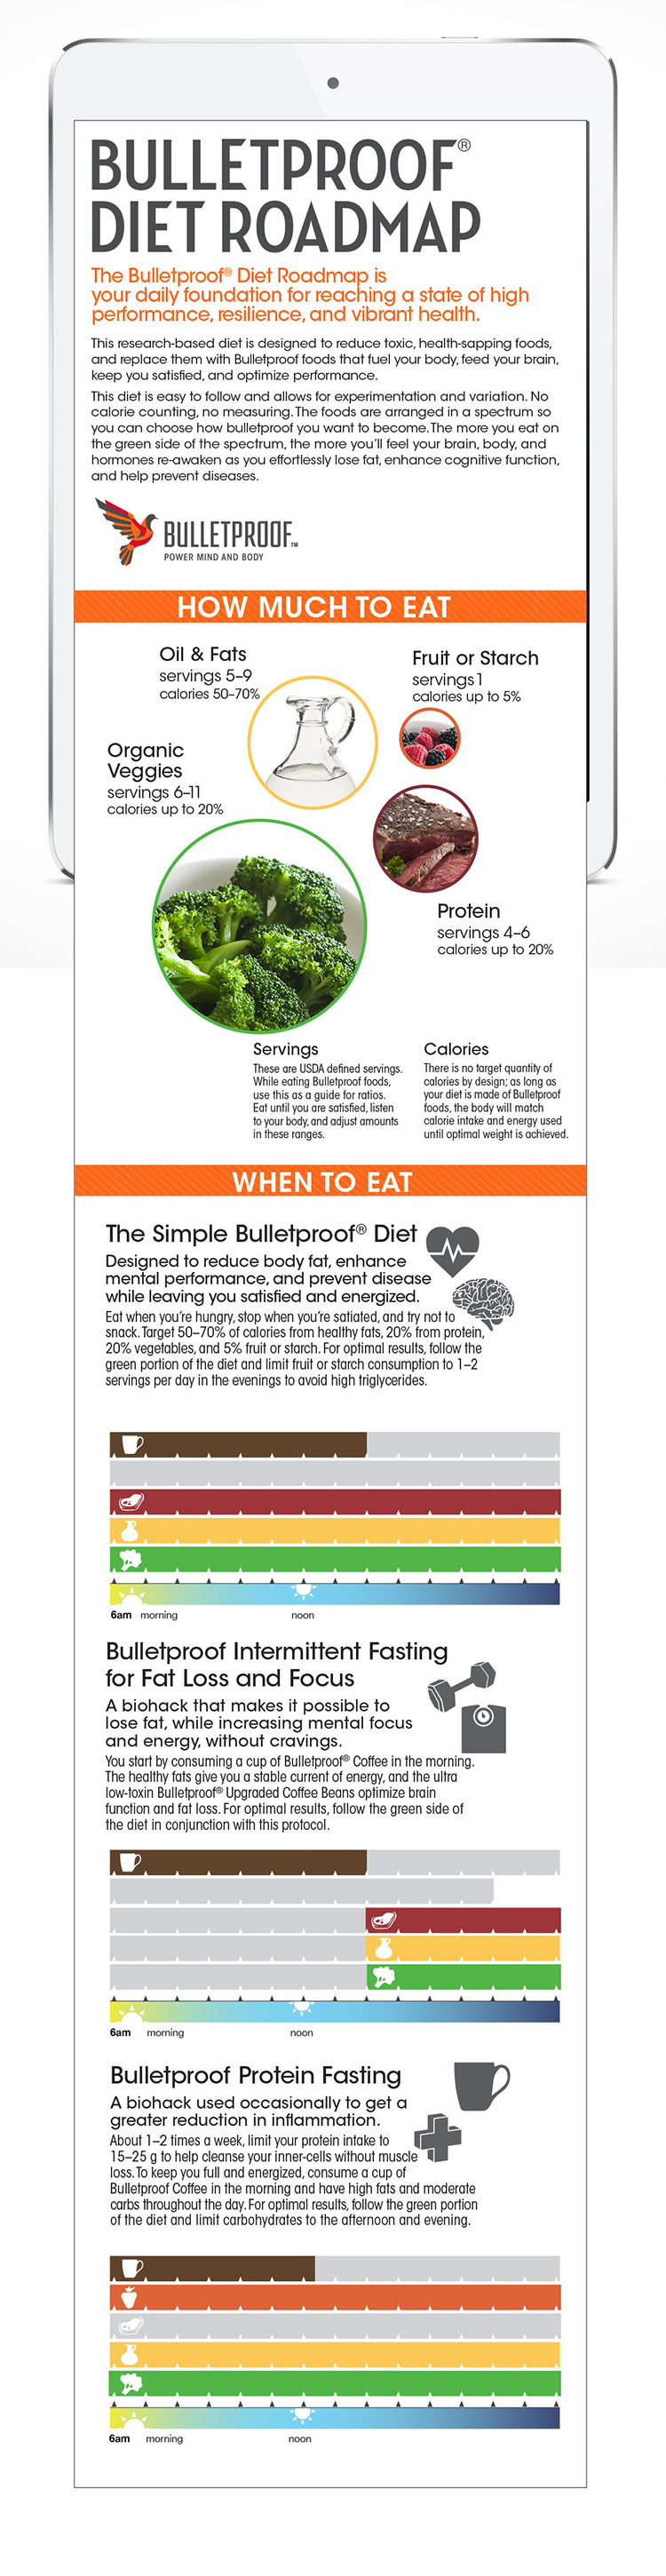
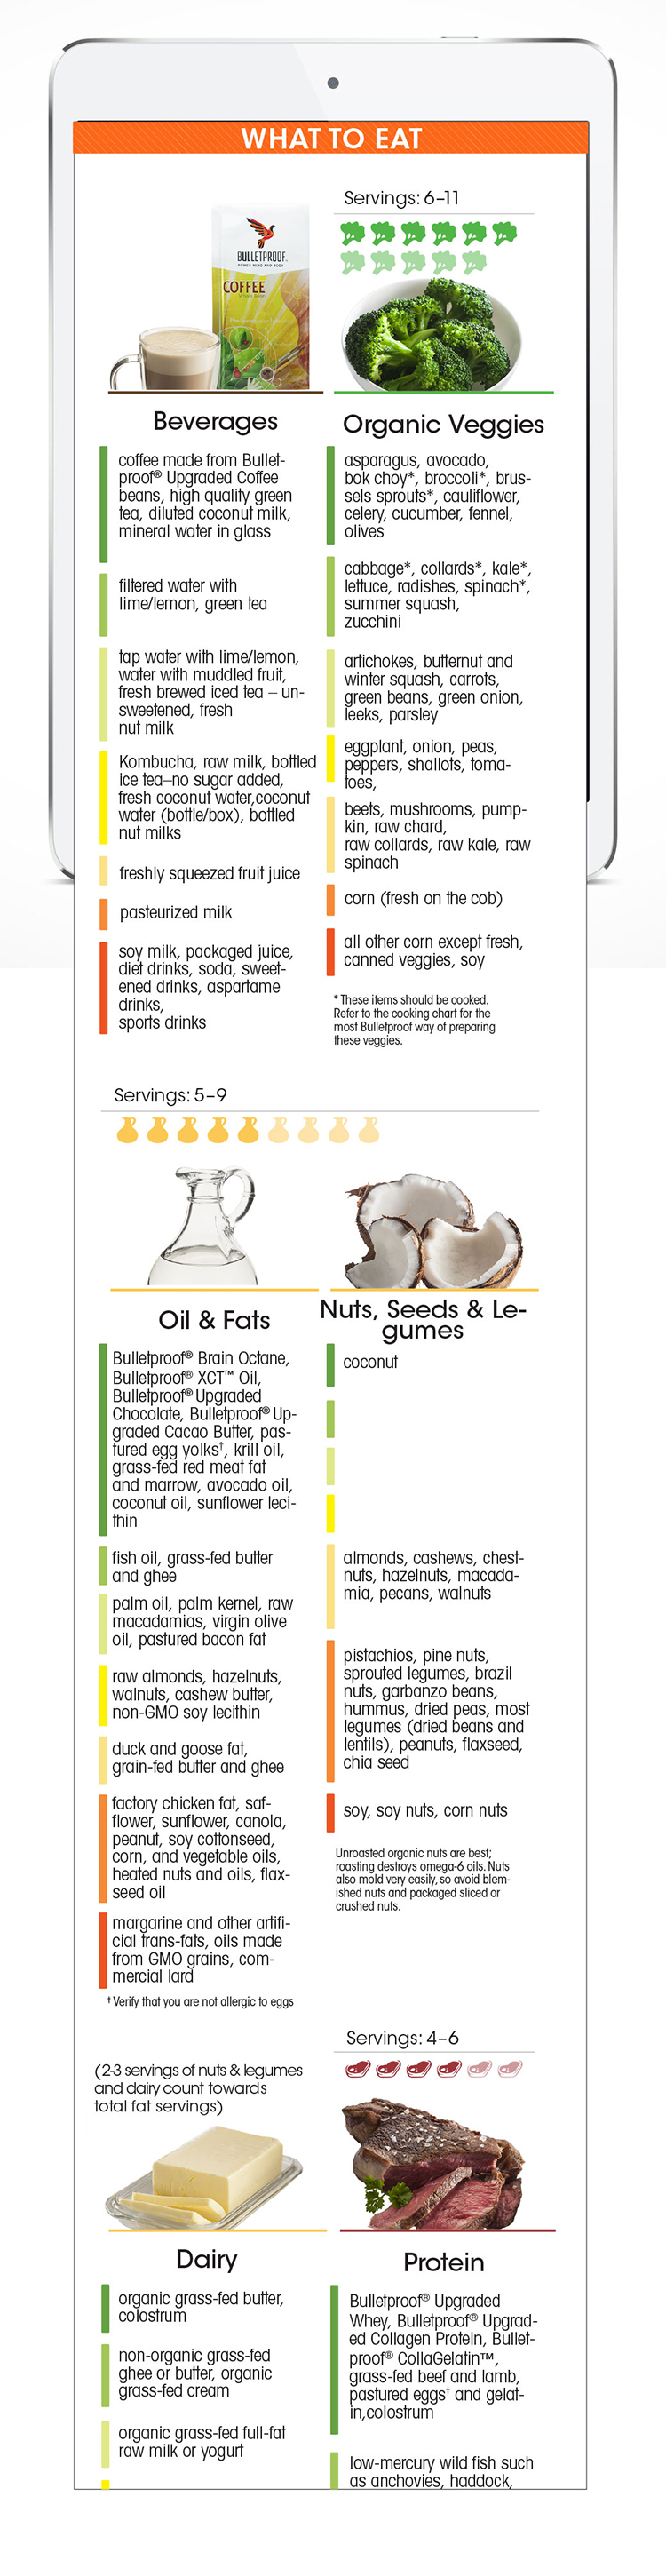
Infographics for Mobile and Social Media
We have created large posters full of complex information carefully organized for a quick understanding. This format works well for desktop reading, or for merchandising or display. However, more and more people are reading the news and learning on their smartphones and mobile devices and need information designed specifically for this format. We have been working on ways to break down complicated infographics into mobile-ready sections. Each frame stands on its own or can be combined together with others in a series to tell a bigger story. Designed in a compact format, these infographics are ready to be posted, tweeted and shared in social media.


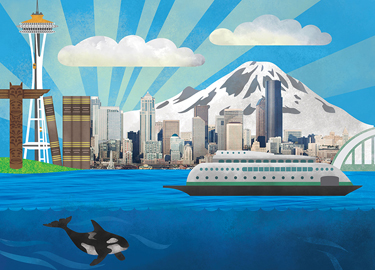
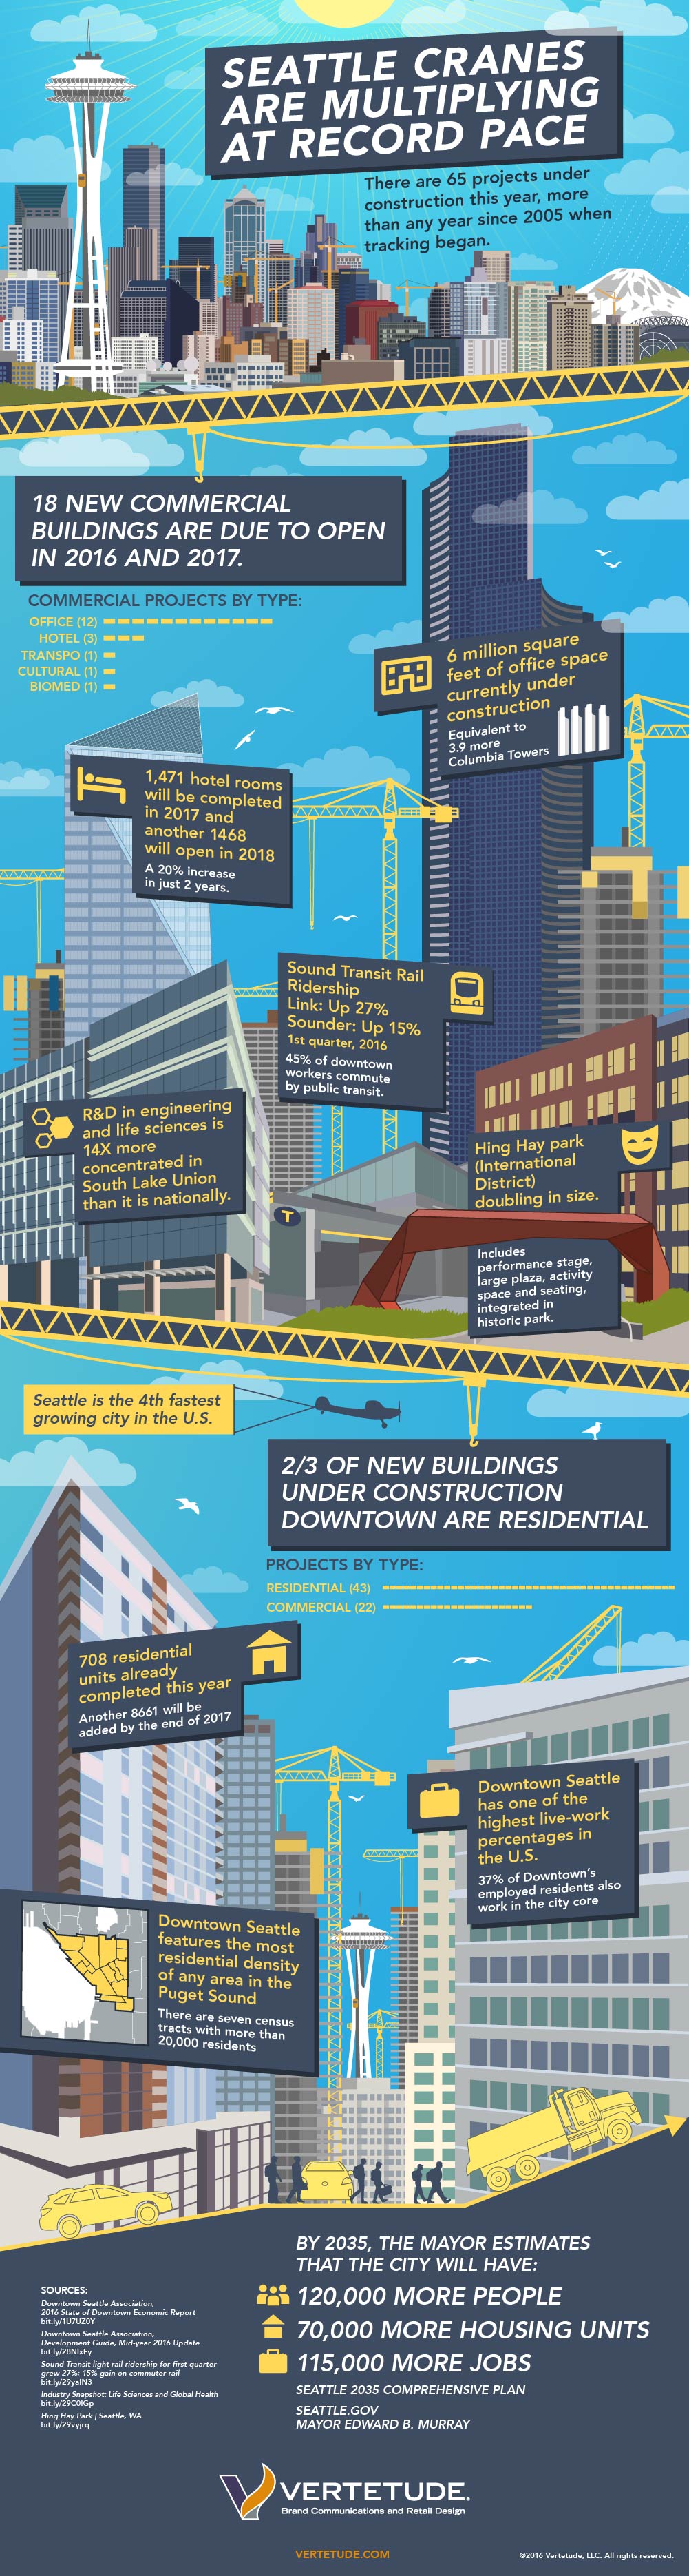
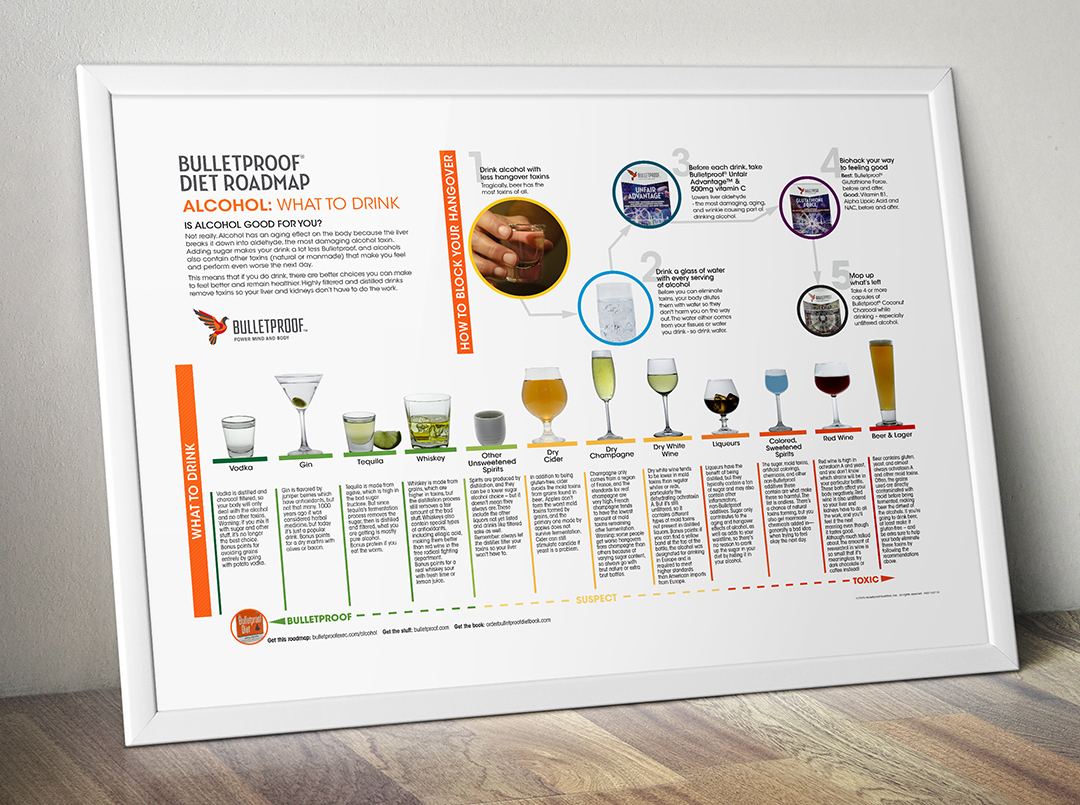
Large Format Infographics
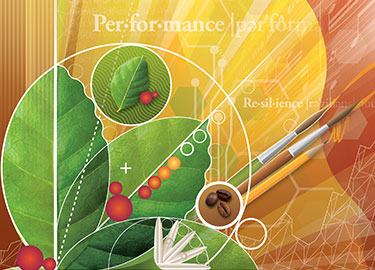
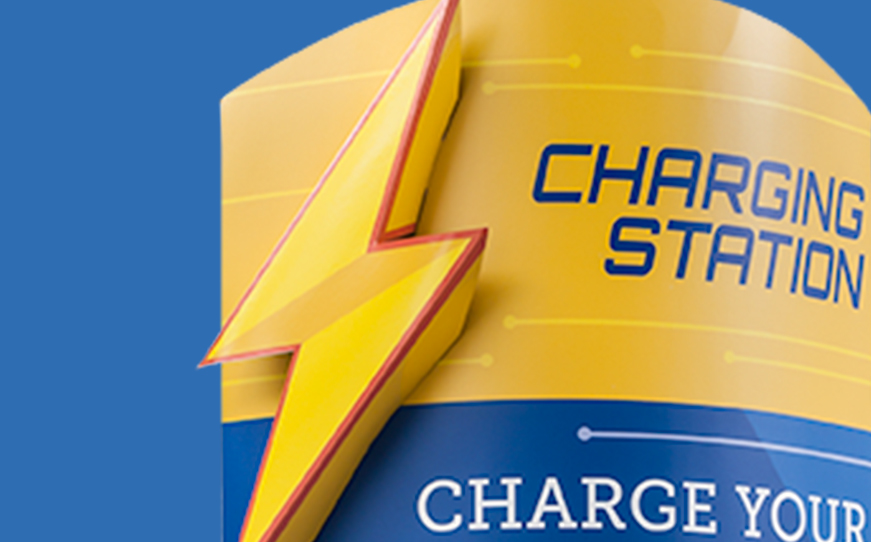
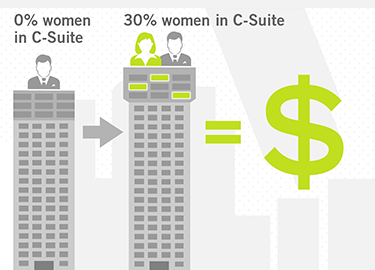
Strategically chosen photographs and illustrations enhance infographic design to tell a powerful visual story that supports key copy points and to create a communication vehicle that elevates the brand.
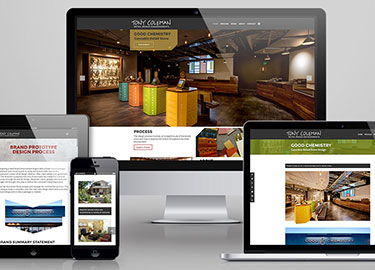
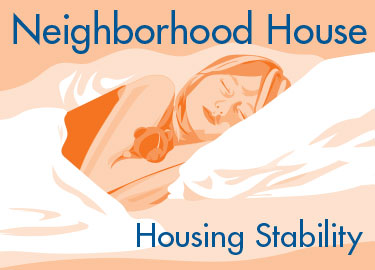
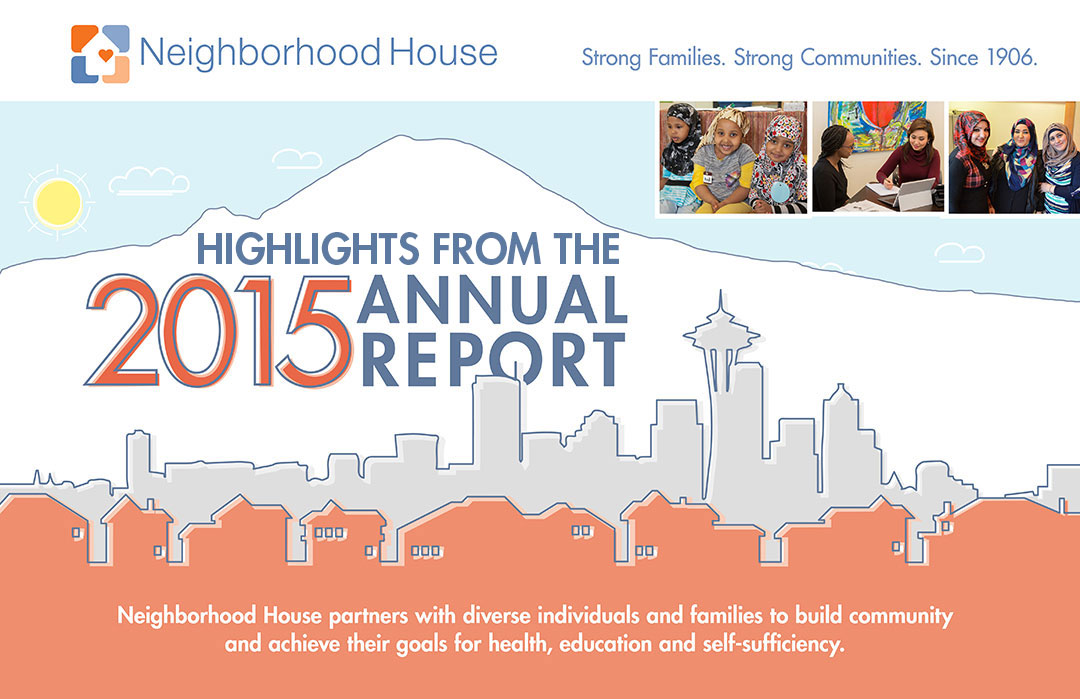
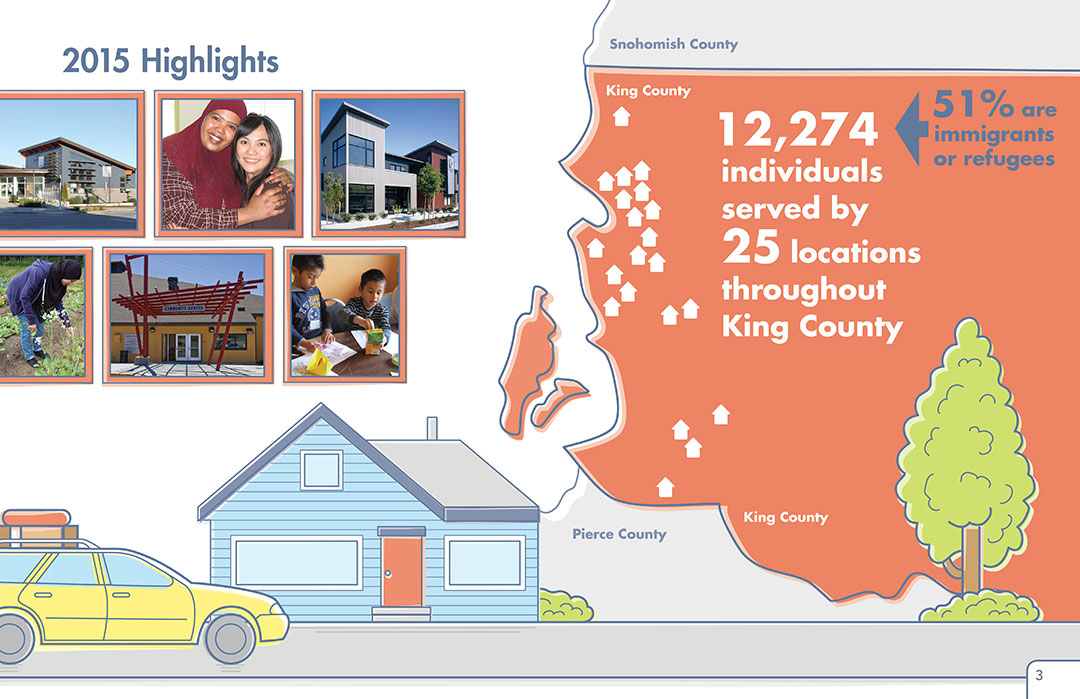
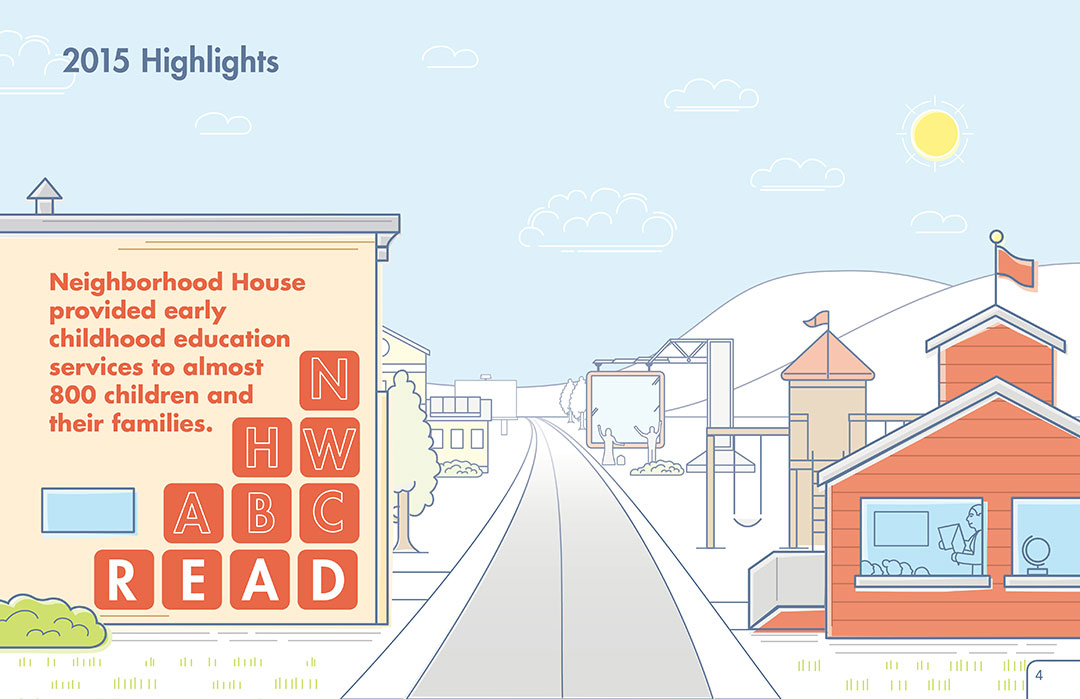
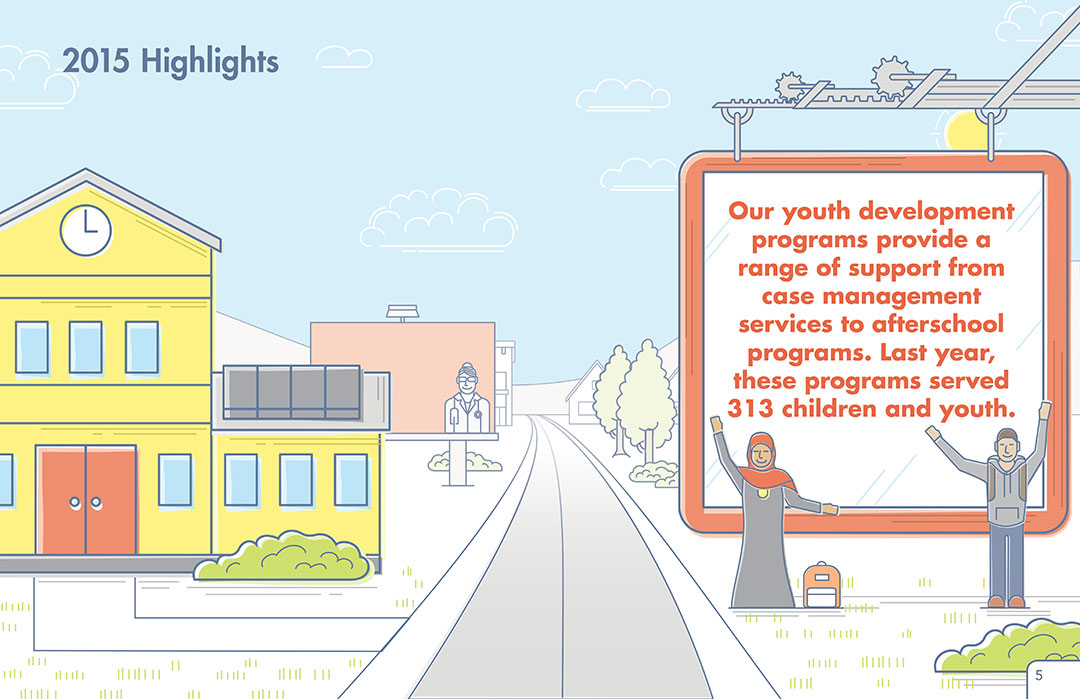
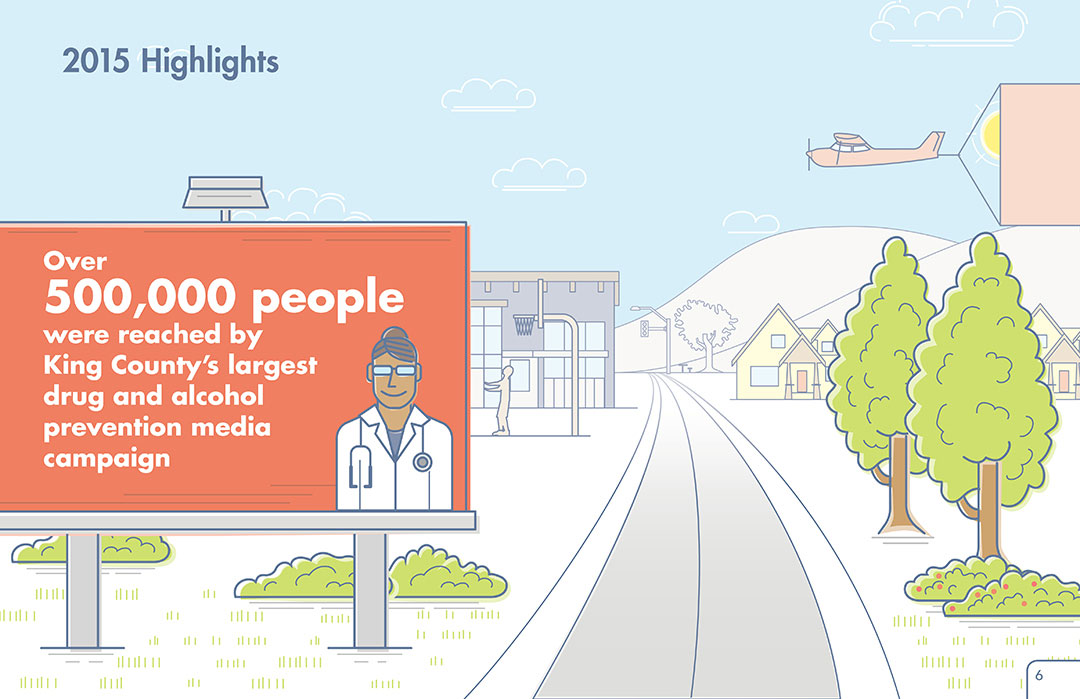
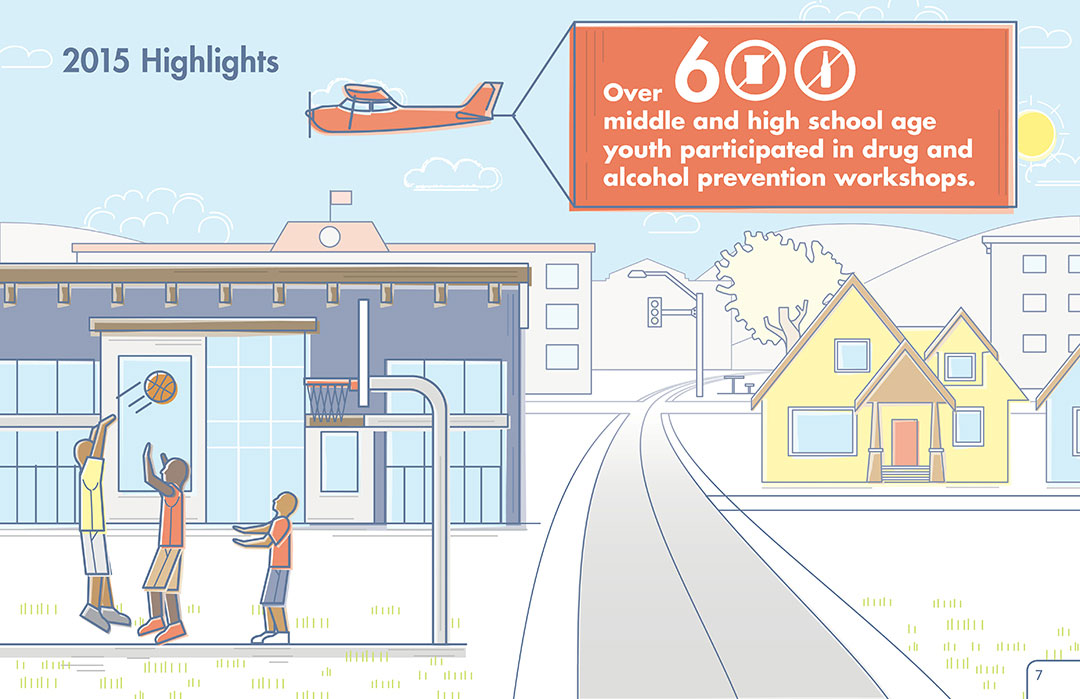
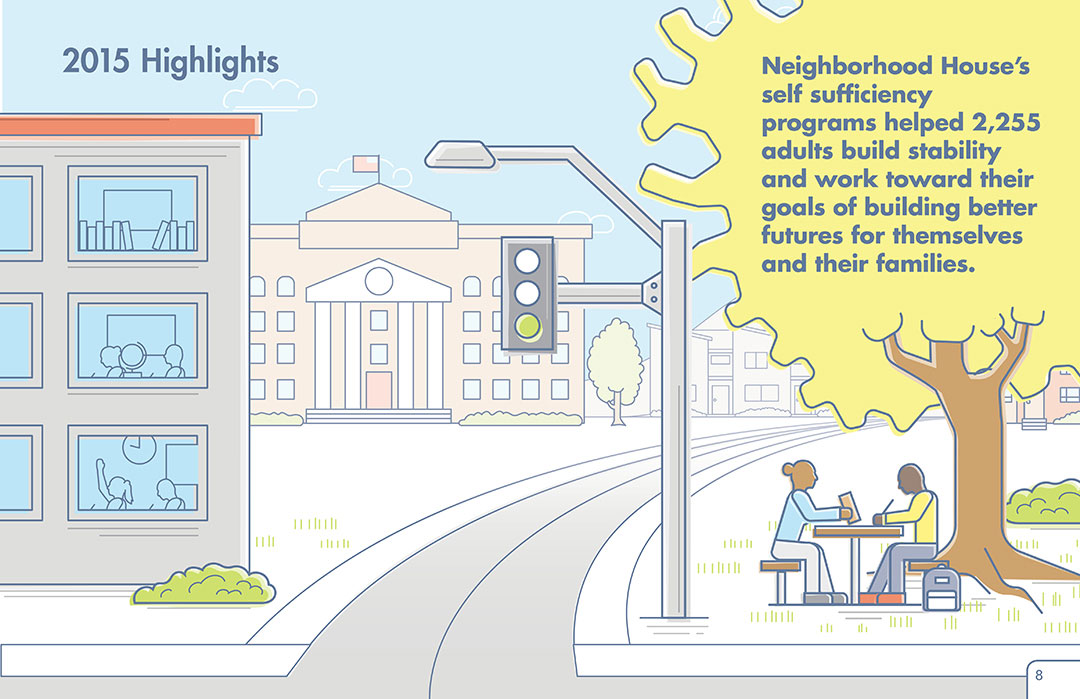
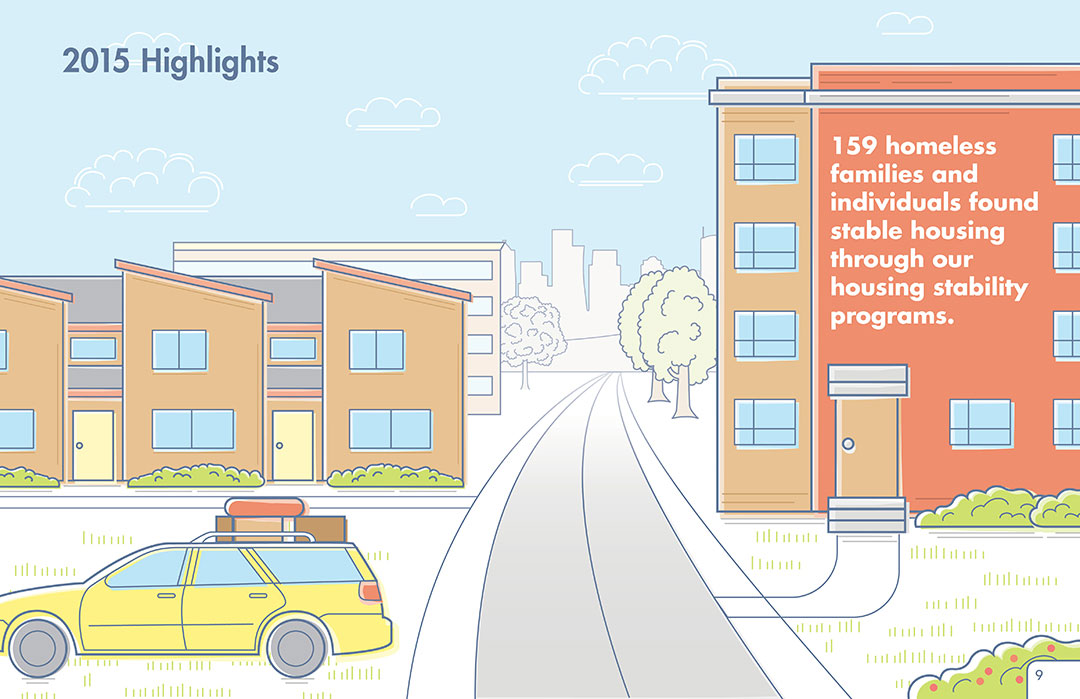
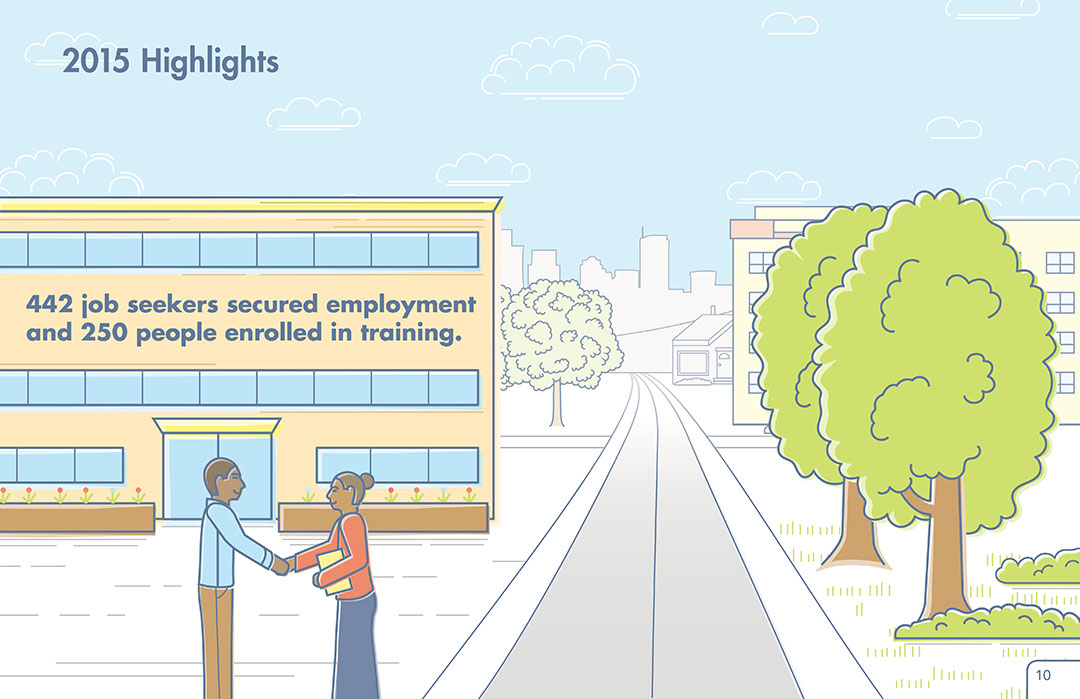
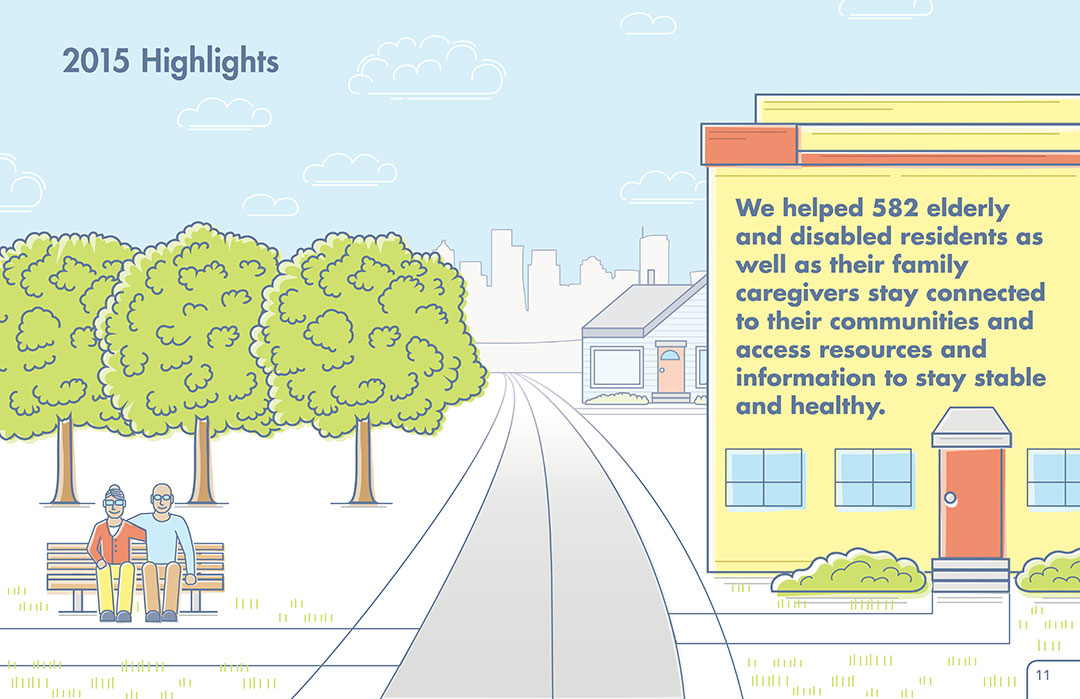
Neighborhood House Annual Report
The annual report is designed to describe the year’s key projects and programs and to highlight action taken and results achieved through original illustration, as well photography from Neighborhood House.
View More Projects