In math class, story problems were my favorite. It was easier to understand the numbers and their relationships in the context of a story.
At Vertetude we see infographics as the best kind of story problems. We use our design and communication skills to share data and complex information using images that convey background, scope and scale, context or story details to make the information more vivid and clear.
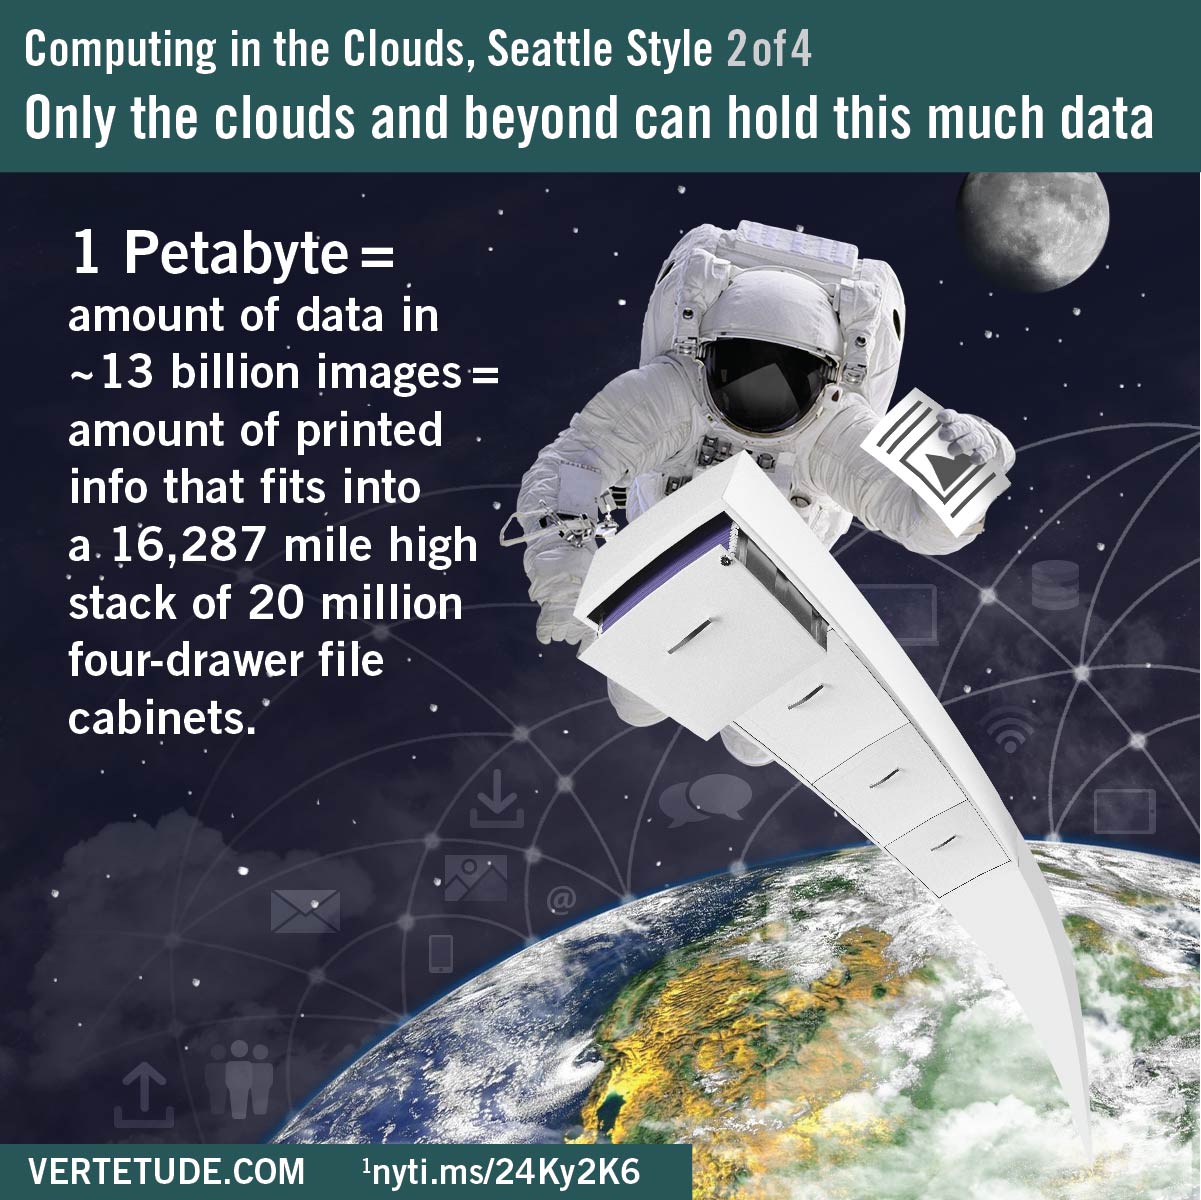
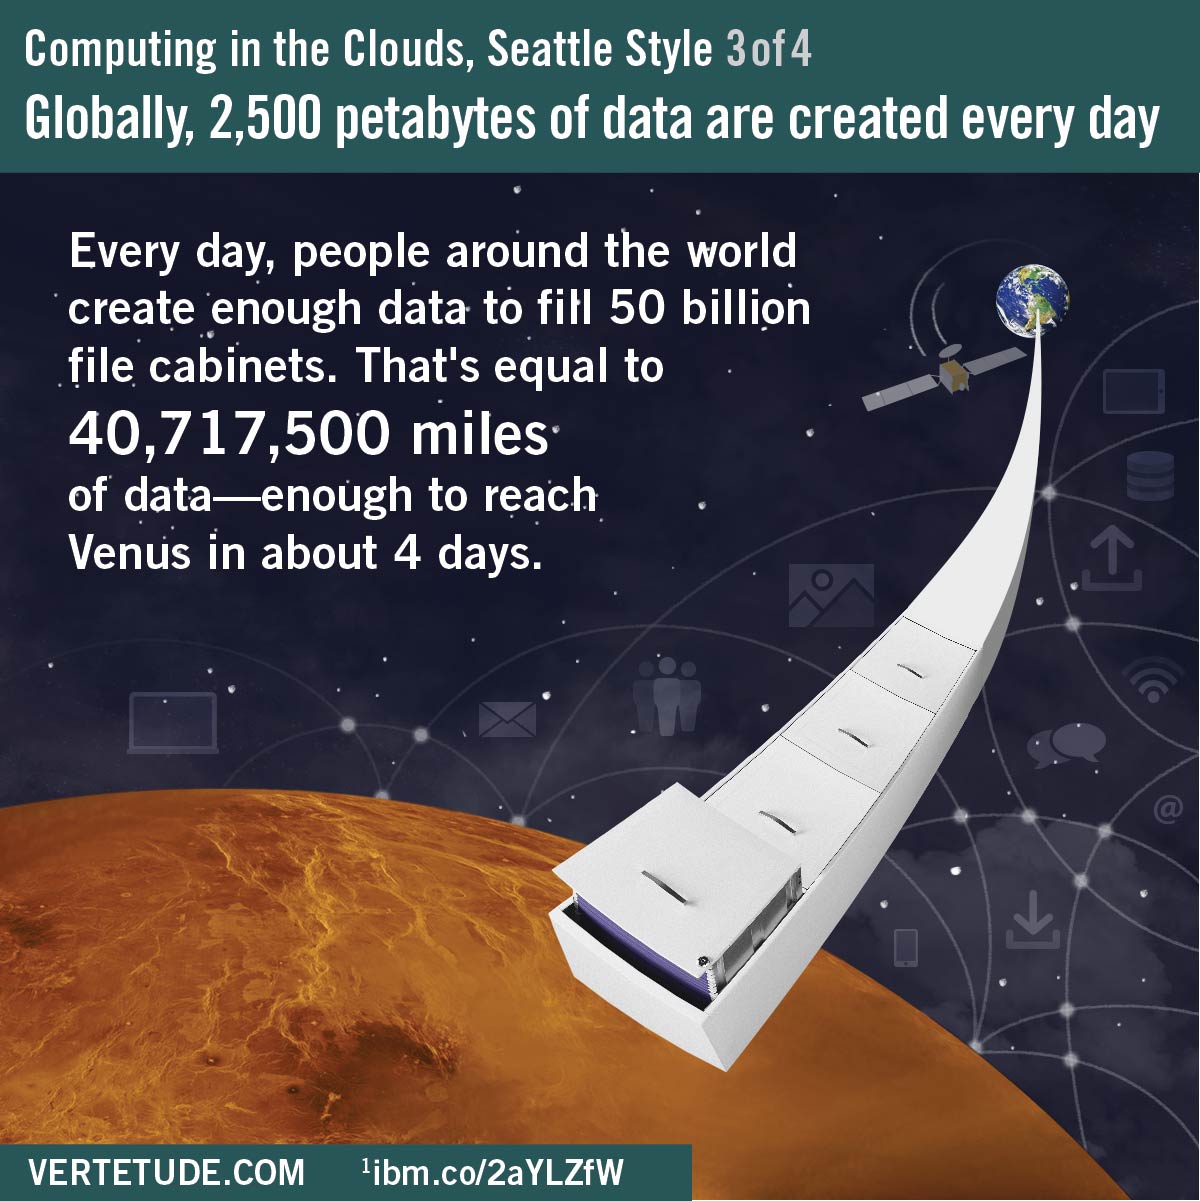
Big data is practically impossible to get our heads around; it’s hard to imagine how really big is big. We know cloud computing’s imprint on the Pacific Northwest drives growth and innovation. This social media and mobile-friendly infographic series is our attempt to understand why big data and cloud computing are so important right now.
If you have a story problem to solve, let us know. We would love to help you find the answer.